Table of Contents
Today Non- Subscribers get a FREE taste of what they are missing out on.
Have a read of this Insight Politics article then decide whether or not you would like to subscribe to a Silver subscription or upgrade your existing Basic or Bronze level Subscription to Silver.
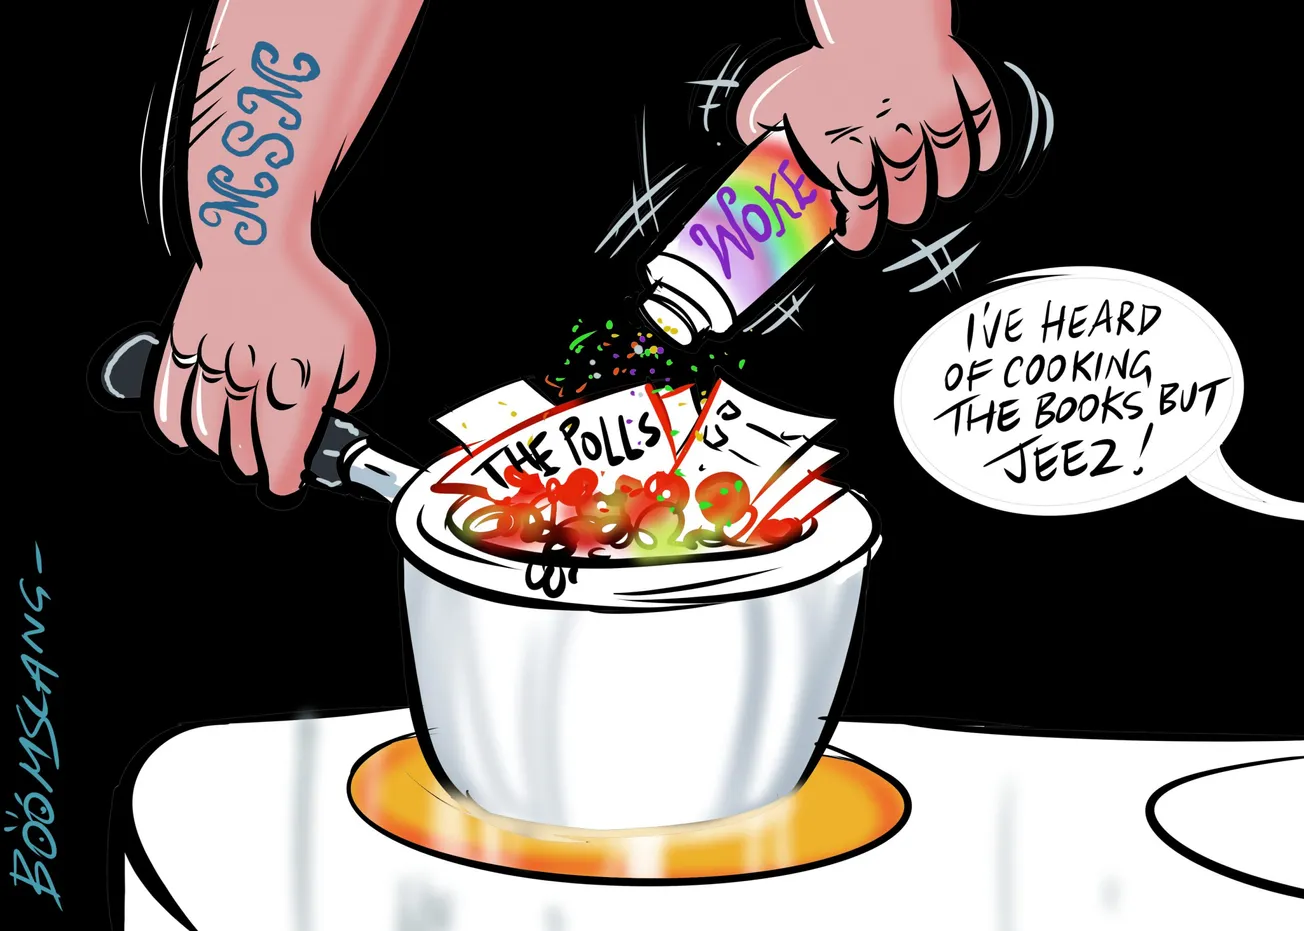
The Polls and a Prediction
It is tempting to write off the polls when you are losing but then you have to ignore them when you’re winning. Few are that consistent. The right is currently on the losing side of polling in New Zealand. Commentators or politicians from the right will point to the ‘inaccuracy’ of polling in Australia’s parliamentary election last year or Trump’s presidential victory in 2016 as evidence of the decreasing relevance of opinion polling but I think they’d be wrong to do so.
Apples and Oranges
New Zealand has a highly proportional electoral system in which the number of seats a party wins in Parliament is generally the same as the proportion of party votes they received. Of course there are exceptions:
- Parties getting up to 4.99% of the party vote will still have 0% of the seats due to the 5% threshold required.
- Parties that win an electorate seat but achieve 4.99% of the party vote will have 6 seats in Parliament (dependent on the proportion of wasted vote).
- Parties that win more electorate seats than their party vote alone would have won, have a higher number of MPs than proportionality alone would have delivered. Otherwise known as an overhang; the 2008 election demonstrated this scenario best
- 6.51% of all party votes were ‘wasted’ (cast for parties that failed to enter Parliament)
- 120 seats were apportioned from 93.49% of the vote
- Each seat therefore was worth about 0.78% of the vote
- The Maori Party won 2.39% of the party vote but also won electorate seats so they remained in Parliament
- 2.39% of the party vote is worth 3 seats but the Maori Party won 5 electorate seats resulting in a 122 seat Parliament.
Australia’s Preferential Voting system requires voters to rank candidates in single member seats from 1 to however many candidates are available (though it is not compulsory to rank all).
The commentary narrative following the Coalition’s election victory is that the pollsters consistently got it wrong and polling just isn’t as relevant as it once was. If you were to isolate the ‘Two Party Preferred’ poll alone you’d be right. The TPP asks a pollee to choose either the Coalition or Labor as their preferred party and Labor (the party isn’t named using the Queen’s English) led the TPP in every poll since August 2017. However the TPP isn’t the only poll question and it isn’t actually that useful as there are more than two parties to choose from.
On the primary vote polling measure, the Coalition Government led or matched Labor’s support in the 28 polls from February 2019 to the election. Taking a poll of the previous five polls, compared to the final election result, primary vote polling wasn’t as useless as you may have been led to believe (POP vs result):
Liberal/National Party: 38.6% vs 41.4% (77 seats/51%)
Australian Labor Party: 35.7% vs 33.3% (68 seats/45%)
Green: 10% vs 10.4% (1 seat/0.7%)
One Nation Party: 4.1% vs 3.1% (0 seats/0%)
You’ll also note that the proportion of seats in Parliament has little relation to the proportion of primary votes cast nationwide as the contest consists of battles in individual electorates only; like New Zealand’s previous First Past the Post system.
Opinion polling in the US 2016 Presidential election is a very similar story. Hillary Clinton led most four-way polls throughout the election campaign, yet lost the election to Donald Trump. Again, if you compare the four-way opinion polls with the final popular vote the polls were fairly accurate. The final polling period of up to November 6 was covered by nine different polling companies, the average result being (POP vs result):
Clinton: 45.4% vs 48.2%
Trump: 42.3% vs 46.1%
Johnson: 4.3% vs 3.3%
Stein: 1.9% v 1.1%
However, the United States Presidential Elections are not won on a nationwide popular vote; rather by winning states with varying numbers of Electoral College votes. To become President, one must win 270 out of 539 electoral college votes. The polls measuring nationwide popular support can present that support properly without predicting the winner because, like New Zealand’s previous FPP system, the presidential election is won in 50 battles in individual states.
Polling in New Zealand
The Mr. Berry Mr. Berry Poll of Polls, like Curia and Radio New Zealand, take the average of the previous five polls to identify trends and smooth out any data spikes. However, that doesn’t mean we are all using the same five polls, as Curia have their own data that Radio New Zealand and myself are not privy to.
Currently the Mr. Berry Mr. Berry Poll of Polls (2 Roy Morgan, 2 Colmar Brunton, 1 Reid Research) shows:
Labour: 54.98% (69 seats)
National: 29.72% (38 seats)
Greens: 6.54% (8 seats)
Act: 3.94% (5 seats)
New Zealand First: 1.96%
Maori: 0.96%
New Conservative: 0.93%
TOP: 0.7%
Were the same methodology to be applied to the 2017 general election (2 Colmar Brunton, 2 Reid Research, 1 Roy Morgan), the results would be (POP v result):
National: 43.8% vs 44.4% (-0.6%)
Labour: 39.1% vs 36.9% (+2.2%)
Greens: 7.2% vs 6.3% (+0.9%)
New Zealand First: 6% vs 7.2% (-1.2%)
TOP: 1.7% vs 2.4% (-0.7%)
Maori: 1% vs 1.2% (-0.2%)
Act: 0.5% vs 0.5%
Rogue Poll?
As I alluded to in the opening paragraph, National leader Judith Collins has criticised the most recent Reid Research poll as being “rogue” though she no doubt had much more confidence in the Preferred Prime Minister polling which showed her far behind Jacinda Ardern but receiving a sizeable boost since becoming Leader of the National Party.
The Reid Research Poll published on July 27 showed Labour on 60.9% and National on 25.1%. A Colmar Brunton poll published on July 30 showed Labour on 53% and National on 32%. The first covered the period in which Todd Muller resigned as Leader of National; the latter covered Judith Collins being elected Leader.
The three most recent Reid Research polls (July, May, February 2020) gave Labour 60.9%, 56.5% and 42.5% support vs National 25.1%, 30.6% 43.3%. The three most recent Colmar Brunton polls (July, June, May) gave Labour 53%, 50%, 59% vs National 32%, 38% and 29%.
Roy Morgan has only polled twice this year (July, June) giving Labour 54.5% and 56.5% vs National 27% vs 26.5%.
If there are any polls that one could accuse of being rogue, it would be either Colmar Brunton or Reid Research’s poll in May which painted two notoriously different pictures, sending howls of impotence around the beltway about the failure of polling in the modern age.
Predictions for 2020?
Until my retirement from being a politician in early July, I resisted making any predictions about election results simply because my objectivity was compromised by my job description; promoting the Act party excludes making any public predictions of its demise. However, it is often said that some parties traditionally under-poll or over-poll so I want to see if it is possible to identify a consistent margin for those parties before making a prediction about the results of this year’s election.
New Zealand First under polls on election night results according to the commentators. Take a Poll of Polls vs. results for the previous five elections gives:
2017: (-1.2%) 2014: (-1.0%) 2011: (-2.0%) 2008: (-0.7%) 2005: (+0.4%)
The Greens are said to over poll on election night results, though they also tend to gain seats from special votes. No doubt because their voters are too lazy to cast a vote and those that do weren’t enrolled until they voted.
2017: (+0.9%) 2014: (+1.9%) 2011: (+2.2%) 2008: (+1.7%) 2005: (+0.4%)
Act polls closely to their election night results, however their polling trends in this election are quite different from any I can remember, continuing to increase slowly since mid 2019, influenced by the free speech and firearms law issues.
2017: (even) 2014: (-0.3%) 2011: (+0.2%) 2008: (-0.7%) 2005: (+0.1%)
There is only one factor left to determine what Parliament may look like on election night and that is the Maori seats. There is zero polling data on any individual seat since 2017. We are unlikely to see any until 17 August at the earliest when ‘Marae’ commences election campaign coverage. However, given the trend to an increase in support for Labour over 2017, I’m quite confidently predicting the Maori party won’t gain any seats. Tamaki Makaurau, in which John Tamihere is standing, has a 19% margin for Labour and the candidacy of Marama Davidson is likely to split any anti-Labour sentiment this time just as she did in 2017.
Labour: 46% (59 seats)
National: 37% (47 seats)
Act: 6% (8 seats)
Greens: 5% (6 seats)
New Zealand First: 2.9%
Maori: 1%
New Conservative: 1.2%
TOP: 0.4%
Did you enjoy reading that?
Subscribe to a Silver subscription or upgrade your existing Basic or Bronze level Subscription to Silver today.


