Table of Contents
Donn Dears
cfact.org
Donn is an engineer and retired senior executive of the General Electric Company who spent his career in the power sector. He led organizations that provided engineering services for GE’s large electrical apparatus and spearheaded the establishment of GE subsidiary companies around the world.
The Biden administration and its allies are hell-bent on eliminating America’s CO2 emissions, no matter the consequences, because of a perceived climate threat. A few examples include:
- Coal-fired power plants are being closed and rules are in place preventing the building of new High Energy Low Emission (HELE) coal-fired plants.
- Pipelines have been shut down and new pipelines cancelled.
- Leasing for oil production has been slowed and huge areas of the United States have been placed off limits for oil production.
- Attempts are in the works to use ozone restrictions to prevent fracking.
These actions are weakening the United States and harming Americans.
Meanwhile, China, the country that is the greatest threat to the United States, is proceeding with its economic development without concern for CO2 emissions, in-spite of rhetoric to the contrary.
The use of coal by China is a dramatic example of China’s actions as opposed to its rhetoric. Actions speak louder than words.
This chart from Carbon Brief, compares the installed coal-fired capacity in MW for leading countries and areas of the world.
The fast rising curve is that of China’s coal-fired power plant capacity which dwarfs every other country in the world.
In 2021 China’s total capacity was 1,064,041 MW, which represents 51% of total worldwide coal-fired power plant capacity. (2021 data from Global Energy Monitor)
The United States was the leader in coal-fired power plant capacity in 2000, but usage has since declined dramatically while China’s increased.
During the past ten years, one-third of China’s new coal-fired power plants are HELE plants, the most efficient in the world.
The United States is prevented by regulations from building HELE plants.
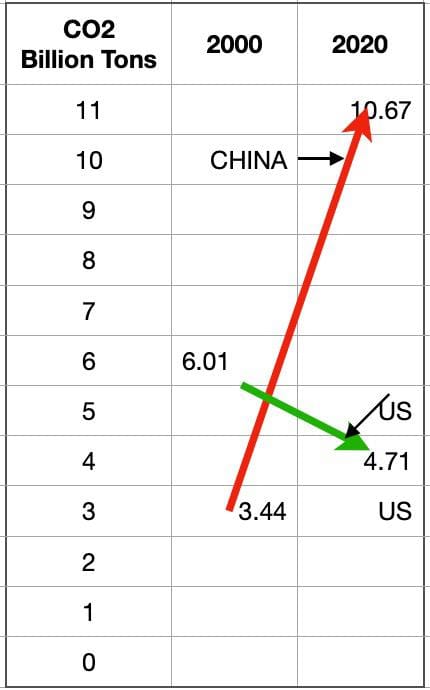
China’s use of coal-fired power plants demonstrates its disregard for the resulting CO2 emissions. China’s CO2 emissions are already twice those of the United States.
China and US CO2 Emissions
China emitted nearly one-third of the world’s CO2 emissions in 2020.
While the media talks about China’s dedication to renewables, the fact is, only 12% of China’s electricity usage was from wind and solar in 2021.

This is no better than the United States where wind and solar also represented 12% of electricity usage in 2021.
Conclusion
China’s use of coal-fired power plants dwarfs usage by all other countries in the world.
While the United States imposes rules and regulations to eliminate the use of fossil fuels, China has little concern about using coal, one of the largest emitters of CO2.
The use of coal overwhelms China’s use of wind and solar.
China’s limited adoption of wind and solar, compared with its emphasis on coal and hydro, demonstrates that China is intent on increasing its economic strength: Seemingly with little concern for climate change.
Meanwhile, the United States is crippling its economy with its war on fossil fuels.
The United States has the largest natural gas reserves in the world, greater than those in the Mideast, yet this administration is attempting to prevent fracking: The technology that has made the United States the envy of the world.
China gets stronger, economically and militarily, while the United States gets weaker with Biden’s war on fossil fuels.
For my reference:
Carbon Brief Left prg https://www.carbonbrief.org/mapped-worlds-coal-power-plants/
Global energy Monitor World coal plants https://globalenergymonitor.org/projects/global-coal-plant-tracker/summary-tables/
China CO2 emissions 2020 https://ourworldindata.org/co2/country/china
Power Mag hydro https://www.nxtbook.com/accessintelligence/POWER/power-july-2022/index.php#/p/20
https://en.wikipedia.org/wiki/Renewable_energy_in_China
US wind and solar 2021 https://www.eia.gov/tools/faqs/faq.php?id=427&t=3
China 2000, 3.44 billion tons 2020 10,67 billion tons
US 2000, 6.01 billion tons 2020 4.71 billion tons


