
Table of Contents

We are at
Level 4of New Zealand’s four-level COVID-19 alert system. It is likely Level 4 measures will stay in place for a number of weeks. More information on alert levels.
- Everyone must now stay home, except those providing essential services.
- Only make physical contact with those that you live with.
Government COVID-19 Response Briefing
The All of Government COVID-19 National Response will provide an update at 1.00 pm today.
Speakers:
- Dr Caroline McElnay, Director of Public Health
Ministry of Health Update:
- Two more deaths
- Total of four deaths now
- Both latest deaths linked to existing clusters.
- Man in his 80s from Wellington, linked to established cluster.
- Man in his 70s, one of 20 residents of Rosewood hospital
- Reinforces importance of Alert Level 4
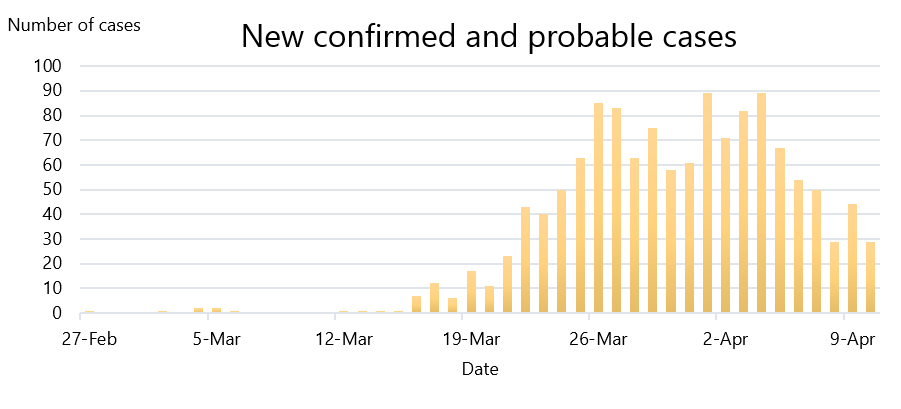
- 29 new cases, 20 confirmed and 9 probable
- 422 recovered
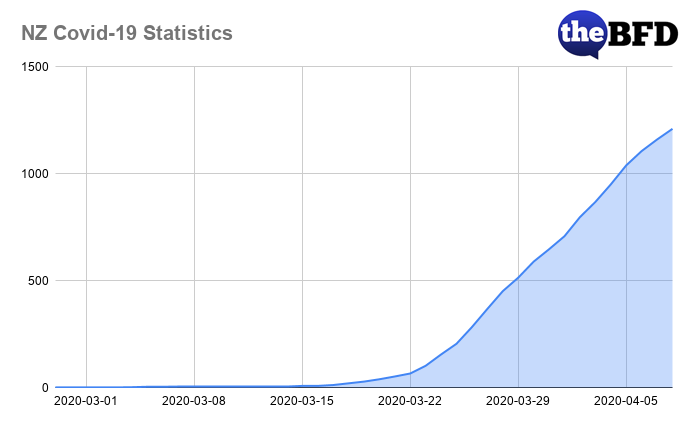
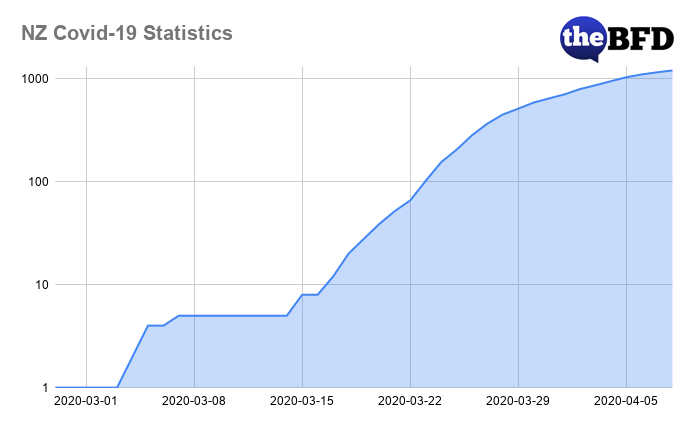
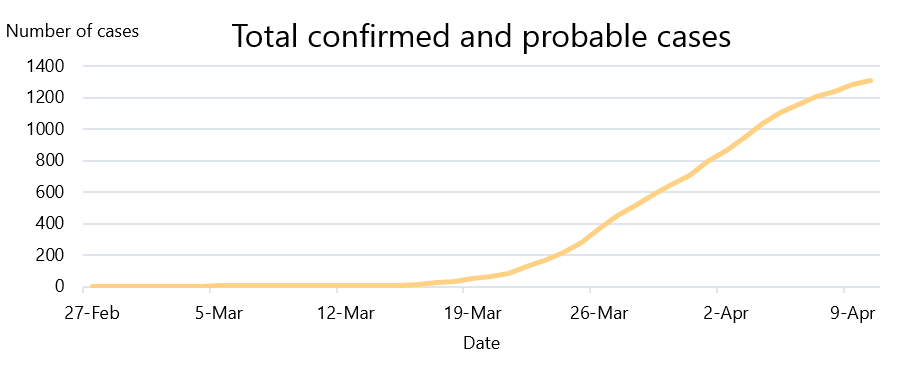
- 1312 total cases
- 15 in hospital, 5 in ICU, 1 in critical condition
- 13 significant clusters, Matamata 70, Bluff 85 cases, Marist 85
- New cluster at an aged care facility in Christchurch. 14 cases confirmed at George Manning Retirement Village
- 3061 tests yesterday. Rolling seven day average 3619 tests, Total tests 58,746
Yesterday’s details:
- Second death, woman in her 90s in Christchurch
- One of a group from Rosewood rest home and Hospital
- Part of that cluster
- Because of alert level 4 her family could not be with her at the hospital.
- Reinforces importance of Alert Level 4
- 44 new cases, 23 confirmed and 21 probable
- 373 recovered
- 1283 total cases
- 16 in hospital, 4 in ICU, 2 in critical condition
- 12 significant clusters, Matamata 69 +5 on yesterday, Bluff 87 cases, Marist 84
COVID-19 – current cases
| Total to date | New in last 24 hours | |
|---|---|---|
| Number of confirmed cases in New Zealand | 1,035 | 20 |
| Number of probable cases | 277 | 9 |
| Number of confirmed and probable cases | 1,312 | 29 |
| Number of cases in hospital | 15 | -1 |
| Number of recovered cases | 422 | 49 |
| Number of deaths | 4 | 2 |
Note: The number of confirmed and probable cases reported in the last 24 hours includes cases which were entered on an earlier date as ‘under investigation’ or ‘suspected’ whose status has now been changed to confirmed or probable.
View details of confirmed and probable cases.
View details of significant COVID-19 clusters.
View interactive map and dashboard.
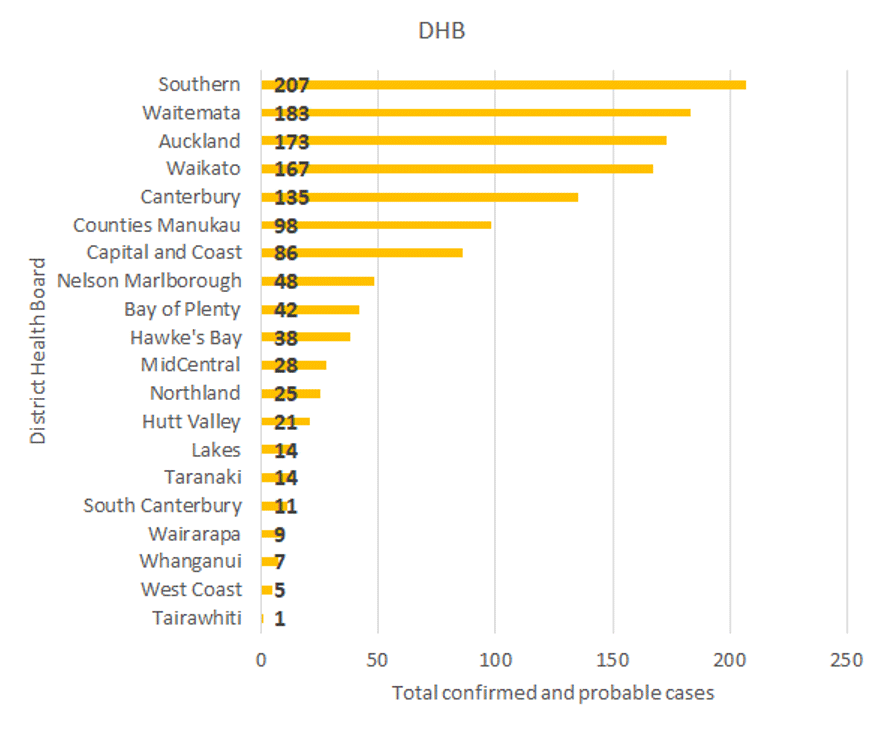
Confirmed and probable cases by DHB
Total cases by DHB in hospital
| DHB | Total cases |
|---|---|
| Auckland | 3 |
| Canterbury | 1 |
| Capital & Coast (Wellington) | 1 |
| Counties Manukau (Middlemore) | 2 |
| Hawke’s Bay | 1 |
| Nelson Marlborough | 1 |
| South Canterbury | 1 |
| Southern | 2 |
| Waikato | 1 |
| Waitemata | 2 |
| Total | 15 |
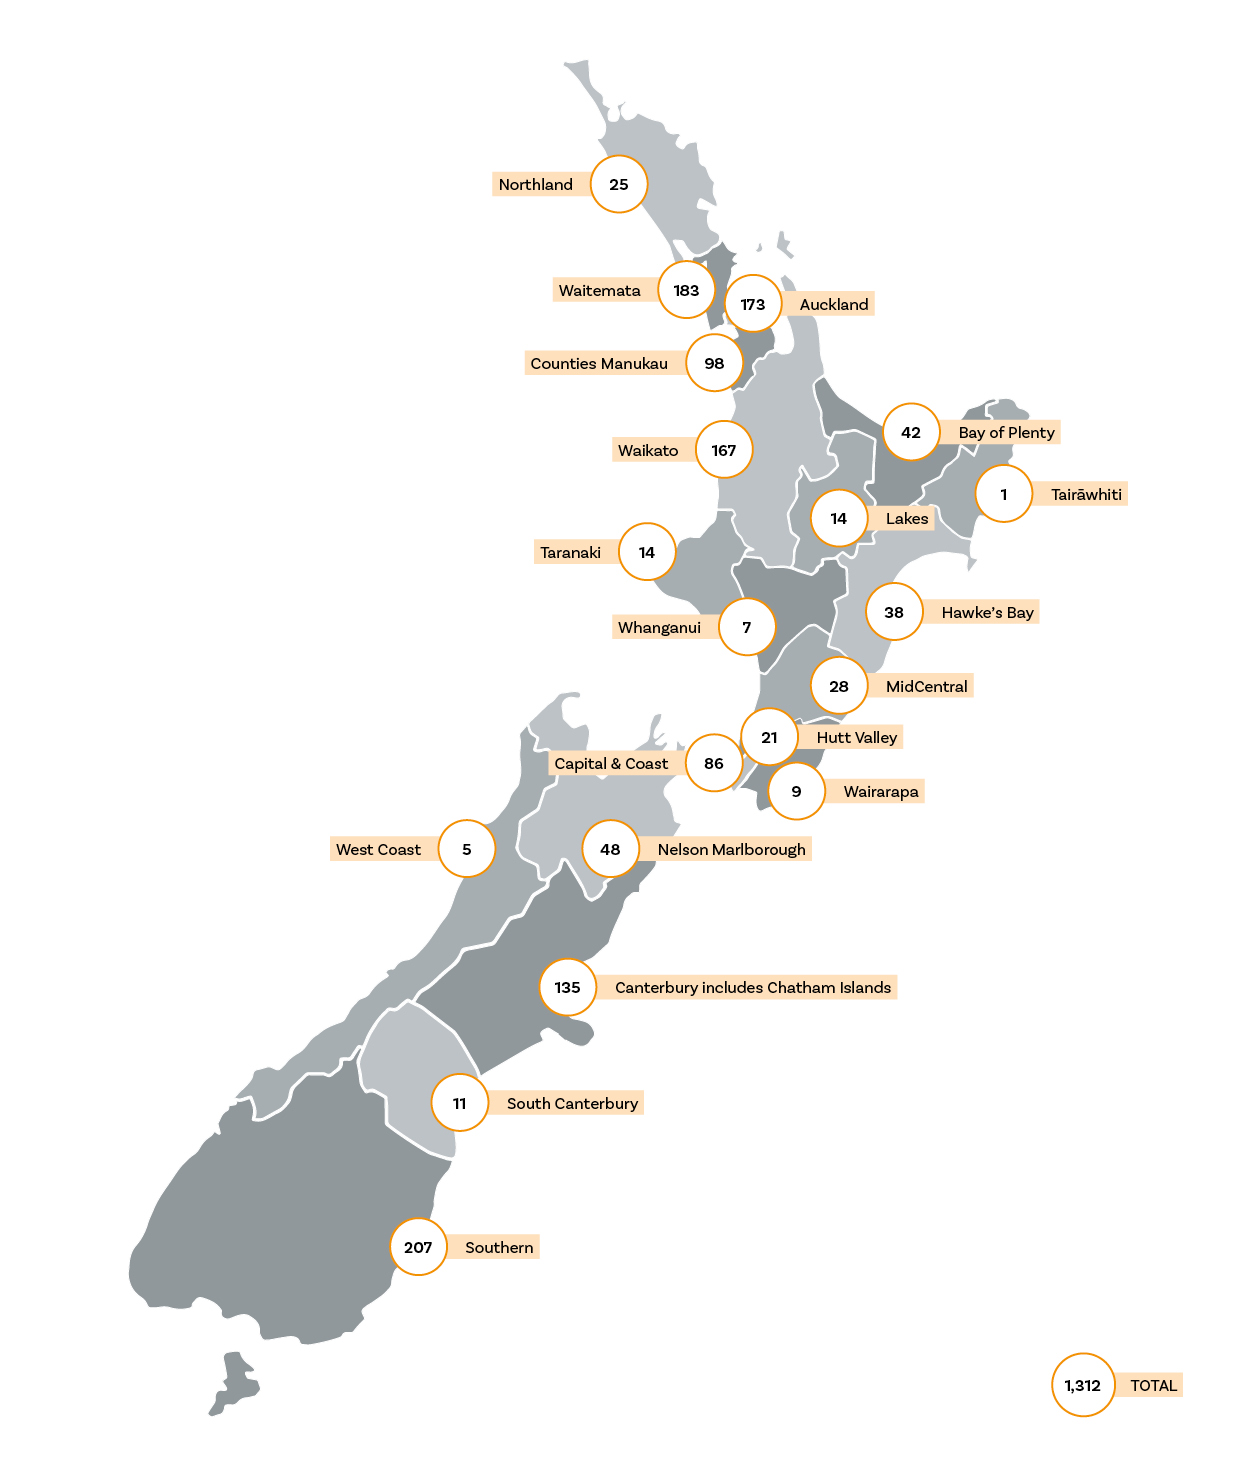
Download the Map of confirmed and probable cases by DHB (PDF, 282 KB).
Total cases in hospital by DHB
| DHB | Number of cases | Change in last 24 hours |
|---|---|---|
| Auckland | 173 | 4 |
| Bay of Plenty | 42 | 3 |
| Canterbury | 135 | 0 |
| Capital and Coast | 86 | 0 |
| Counties Manukau | 98 | 3 |
| Hawke’s Bay | 38 | 3 |
| Hutt Valley | 21 | 0 |
| Lakes | 14 | 1 |
| MidCentral | 28 | 0 |
| Nelson Marlborough | 48 | 0 |
| Northland | 25 | 1 |
| South Canterbury | 11 | 0 |
| Southern | 207 | 5 |
| Tair?whiti | 1 | 0 |
| Taranaki | 14 | 0 |
| Waikato | 167 | 1 |
| Wairarapa | 9 | 1 |
| Waitemata | 183 | 7 |
| West Coast | 5 | 0 |
| Whanganui | 7 | 0 |
| Total | 1,312 | 29 |
Epidemic Curve
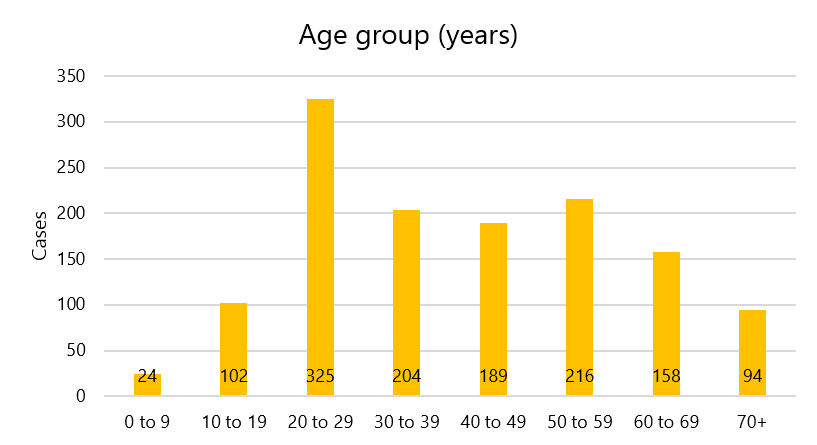
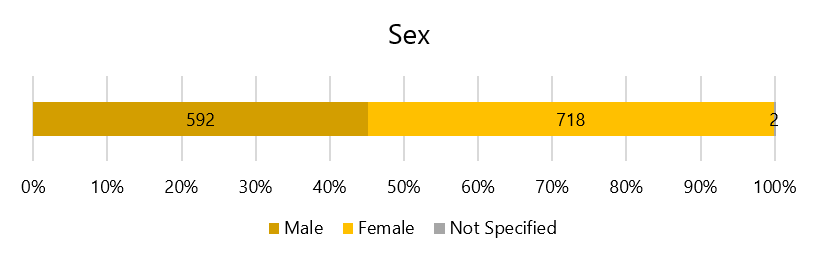
Total Cases by Age and Gender
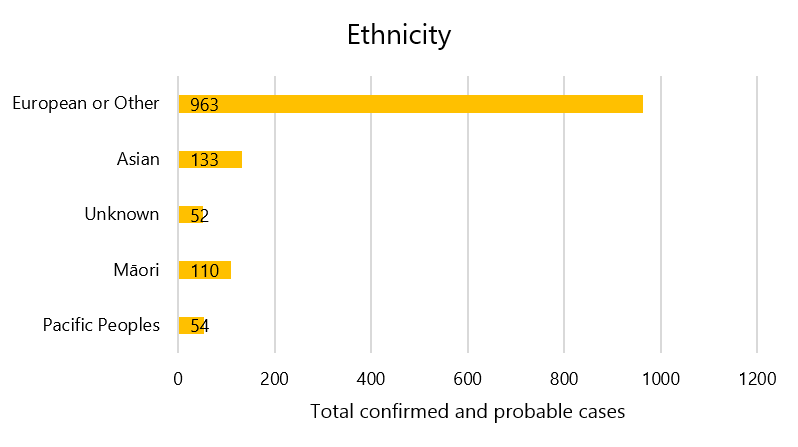
Ethnicity percentages of all cases
Transmission
This information refers to the 1,312 confirmed and probable cases as at 9.00 am 11 April 2020.
| Transmission type | % of cases |
|---|---|
| Recent overseas travel | 40% |
| Contact with known case | 46% |
| Community transmission | 2% |
| Source under investigation | 11% |
Source: ESR EpiSurv extract as at 09:00 11 April 2020
Lab testing and capacity
| Lab Testing | Tests | Date |
|---|---|---|
| Total tested yesterday | 3,061 | 10 April 2020 |
| 7-day rolling average | 3,619 | 3 April to 10 April 2020 |
| Total tested to date | 58,746 | 22 January to 10 April 2020 |
| Supplies in stock | 53,042 | 11 April 2020 |
Source: Lab update as at 09:00 11 April 2020
For a detailed break down of ethnicity and DHB region testing see Testing by region.
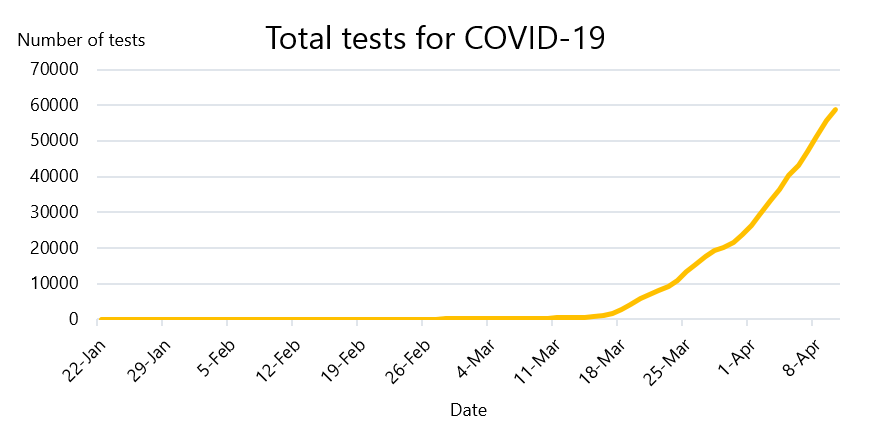
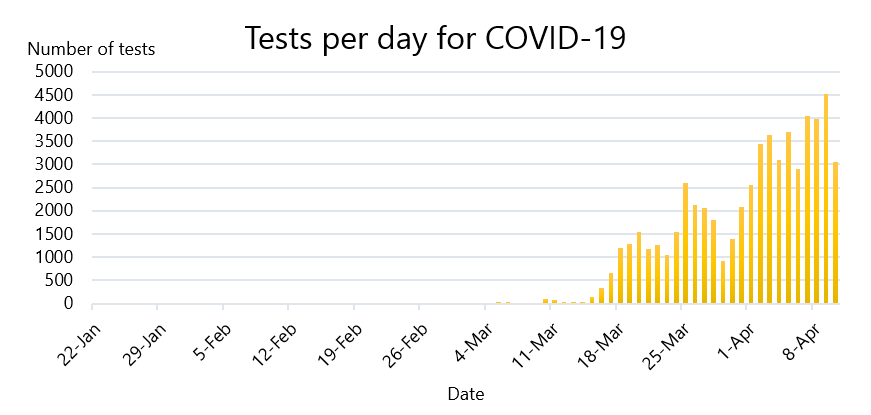
COVID-19 – tests by day and cumulative
| Date | Tests per day | Total tests (cumulative) |
|---|---|---|
| 22 Jan – 8 Mar | 300 | |
| 9-Mar | 12 | 312 |
| 10-Mar | 89 | 401 |
| 11-Mar | 83 | 484 |
| 12-Mar | 31 | 515 |
| 13-Mar | 35 | 550 |
| 14-Mar | 34 | 584 |
| 15-Mar | 142 | 726 |
| 16-Mar | 325 | 1051 |
| 17-Mar | 659 | 1710 |
| 18-Mar | 1209 | 2919 |
| 19-Mar | 1291 | 4210 |
| 20-Mar | 1554 | 5764 |
| 21-Mar | 1176 | 6940 |
| 22-Mar | 1256 | 8196 |
| 23-Mar | 1050 | 9246 |
| 24-Mar | 1544 | 10790 |
| 25-Mar | 2592 | 13382 |
| 26-Mar | 2117 | 15499 |
| 27-Mar | 2067 | 17566 |
| 28-Mar | 1809 | 19375 |
| 29-Mar | 918 | 20293 |
| 30-Mar | 1391 | 21684 |
| 31-Mar | 2093 | 23777 |
| 1-Apr | 2562 | 26339 |
| 2-Apr | 3446 | 29785 |
| 3-Apr | 3631 | 33416 |
| 4-Apr | 3093 | 36509 |
| 5-Apr | 3709 | 40218 |
| 6-Apr | 2908 | 43126 |
| 7-Apr | 4049 | 47175 |
| 8-Apr | 3990 | 51165 |
| 9-Apr | 4520 | 55685 |
| 10-Apr | 3061 | 58746 |
Note: Two sets of cumulative test data have been reconciled to give cumulative total from 22 January 2020 when testing began.


