
Table of Contents

We are at
Level 4of New Zealand’s four-level COVID-19 alert system. It is likely Level 4 measures will stay in place for a number of weeks. More information on alert levels.
- Everyone must now stay home, except those providing essential services.
- Only make physical contact with those that you live with.
Government COVID-19 Response Briefing
The All of Government COVID-19 National Response will provide an update at 1.00 pm today.
Speaker:
- Dr Ashley Bloomfield, Director-General of Health
Ministry of Health Update:
- Another four deaths, 1 in Wellington and 3 Rosewood cluster members
- Total of 9 deaths now
- The man in Wellington was admitted on 22 March and had been unwell for some time.
- All new arrivals at aged care goes into isolation for 14 days
- 17 new cases, 8 confirmed and 9 probable
- 628 recovered
- 1366 total cases
- 15 in hospital, 3 in ICU, 1 in critical condition
- 15 significant clusters, Matamata 71, Bluff 86 cases, Marist 85, Aged Residential Care facility in Auckland 10
- 2% are confirmed as community transmission
- 1572 tests processed
- 64,399 total tests
- Bloomfield is claiming we are “past the peak”. Seems rather risky to claim that.
- Private function in Auckland was a stag party
Yesterday’s details.
- Another death, Man in his 80s, Rosewood cluster member, total of 5 deaths now
- 19 new cases, 15 confirmed and 4 probable
- 546 recovered
- 1349 total cases
- 15 in hospital, 4 in ICU, 1 in critical condition
- 15 significant clusters, Matamata 71, Bluff 86 cases, Marist 85, Aged Residential Car facility in Auckland 10
- 2% are confirmed as community transmission
- 1660 tests processed
- 62,827 total tests
COVID-19 – current cases
| Total to date | New in last 24 hours | |
|---|---|---|
| Number of confirmed cases in New Zealand | 1,072 | 8 |
| Number of probable cases | 294 | 9 |
| Number of confirmed and probable cases | 1,366 | 17 |
| Number of cases in hospital | 15 | 0 |
| Number of recovered cases | 628 | 82 |
| Number of deaths | 9 | 4 |
Note: The number of confirmed and probable cases reported in the last 24 hours includes cases which were entered on an earlier date as ‘under investigation’ or ‘suspected’ whose status has now been changed to confirmed or probable.
View details of confirmed and probable cases.
View details of significant COVID-19 clusters.
View interactive map and dashboard.
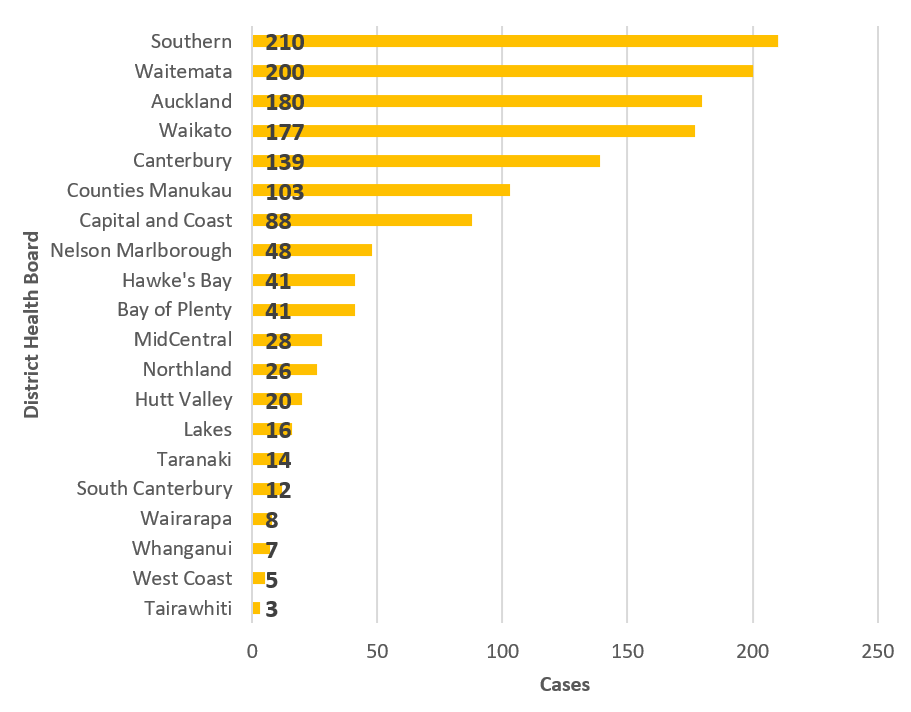
Confirmed and probable cases by DHB
Total cases by DHB in hospital
| DHB | Total cases |
|---|---|
| Auckland | 4 |
| Canterbury | 1 |
| Counties Manukau (Middlemore) | 1 |
| Nelson Marlborough | 1 |
| South Canterbury | 1 |
| Southern | 1 |
| Waikato | 4 |
| Waitemata | 2 |
| Total | 15 |
Note:Three of the 15 in hospital are in ICU as at 8.30 am 14 April 2020.
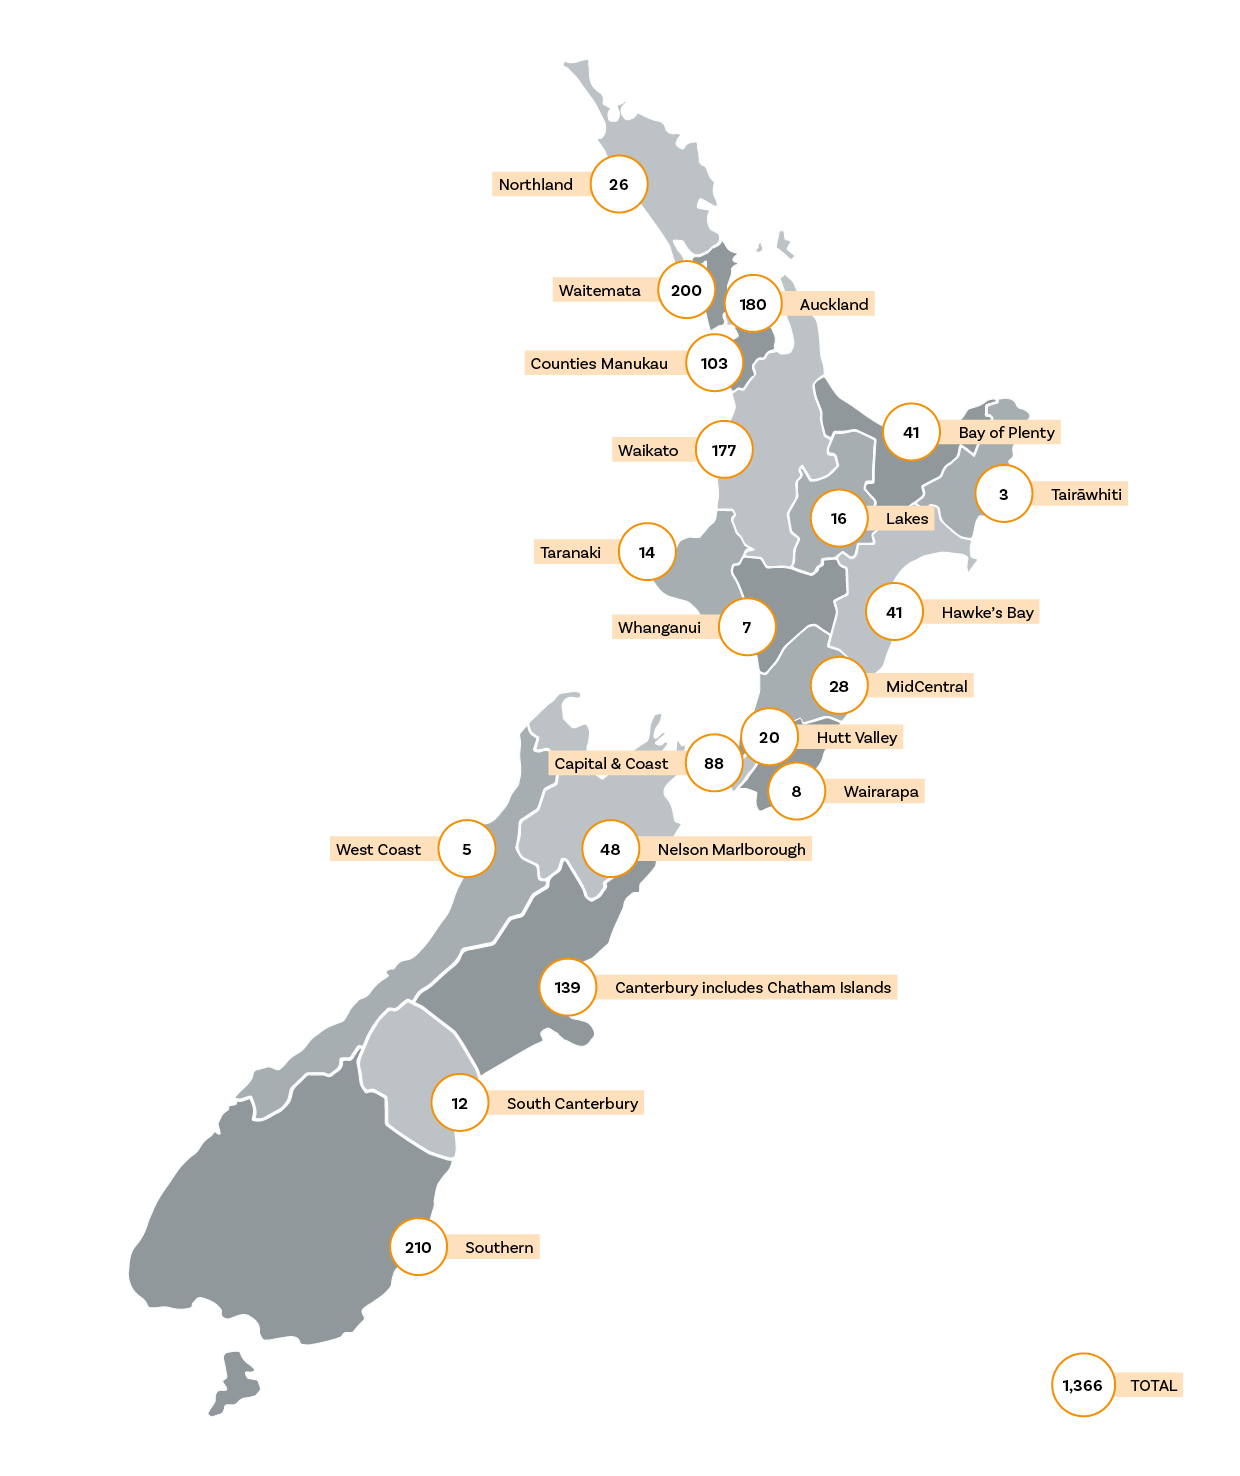
Download the Map of confirmed and probable cases by DHB (PDF, 282 KB).
Total cases in hospital by DHB
| DHB | Number of cases | Change in last 24 hours |
|---|---|---|
| Auckland | 180 | 4 |
| Bay of Plenty | 41 | 0 |
| Canterbury | 139 | 3 |
| Capital and Coast | 88 | 0 |
| Counties Manukau | 103 | 2 |
| Hawke’s Bay | 41 | 0 |
| Hutt Valley | 20 | -2 |
| Lakes | 16 | 0 |
| MidCentral | 28 | 0 |
| Nelson Marlborough | 48 | 0 |
| Northland | 26 | 1 |
| South Canterbury | 12 | 1 |
| Southern | 210 | 1 |
| Tair?whiti | 3 | 2 |
| Taranaki | 14 | 0 |
| Waikato | 177 | 0 |
| Wairarapa | 8 | 0 |
| Waitemata | 200 | 5 |
| West Coast | 5 | 0 |
| Whanganui | 7 | 0 |
| Total | 1,366 | 17 |
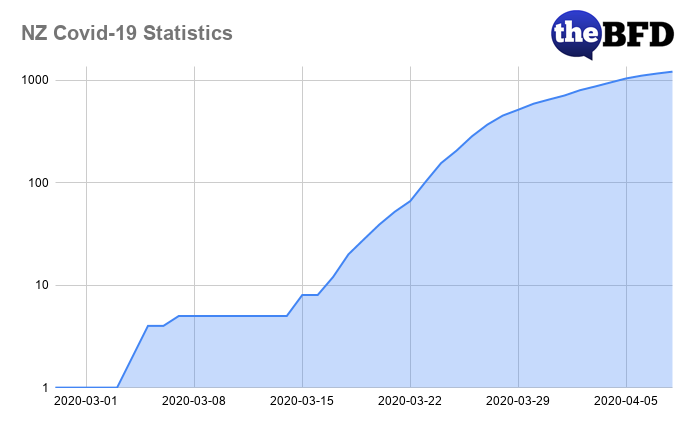
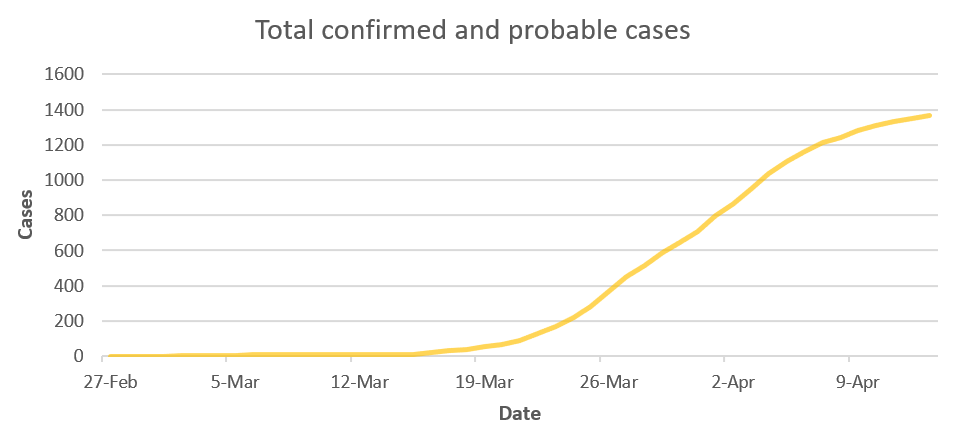
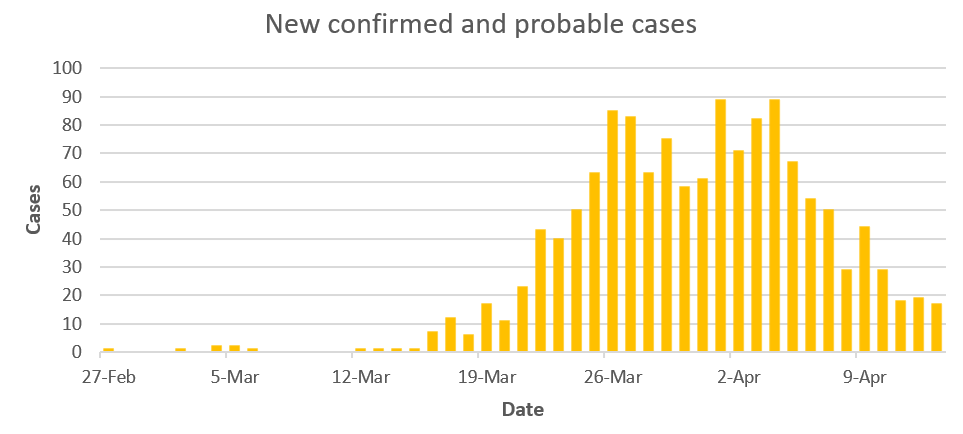
Epidemic Curve
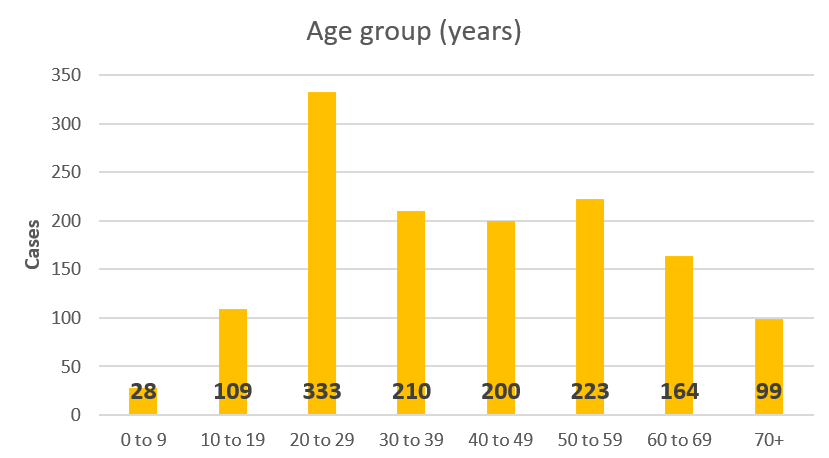
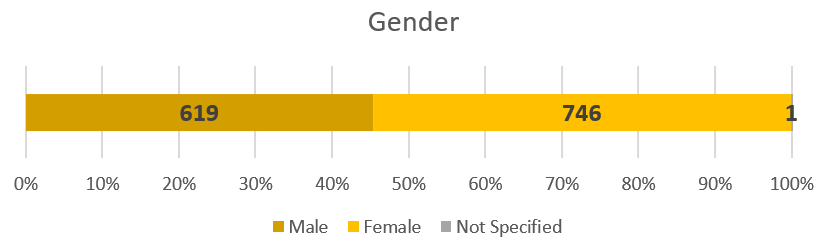
Total Cases by Age and Gender
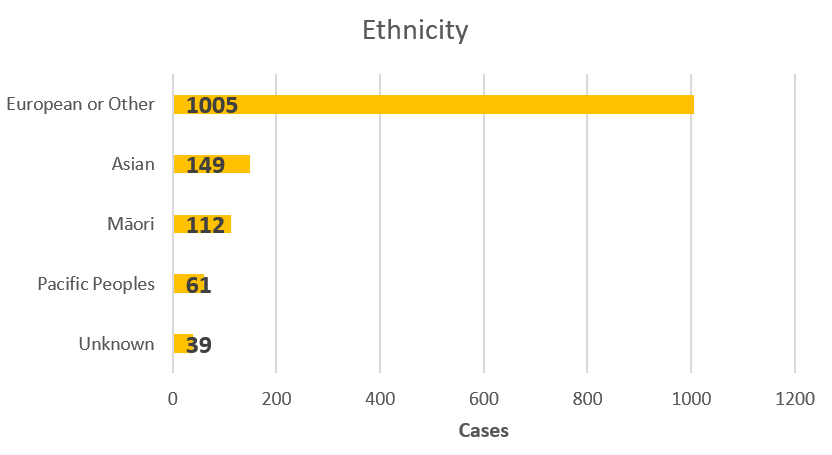
Ethnicity percentages of all cases
Transmission
This information refers to the 1,366 confirmed and probable cases as at 9.00 am 14 April 2020.
| Transmission type | % of cases |
|---|---|
| Recent overseas travel | 39% |
| Contact with known case | 48% |
| Community transmission | 2% |
| Source under investigation | 11% |
Lab testing and capacity
| Lab Testing | Tests | Date |
|---|---|---|
| Total tested yesterday | 1,572 | 13 April 2020 |
| 7-day rolling average | 3,039 | 7 April to 13 April 2020 |
| Total tested to date | 64,399 | 22 January to 13 April 2020 |
| Supplies in stock | 70,826 | 14 April 2020 |
For a detailed break down of ethnicity and DHB region testing see Testing by region.
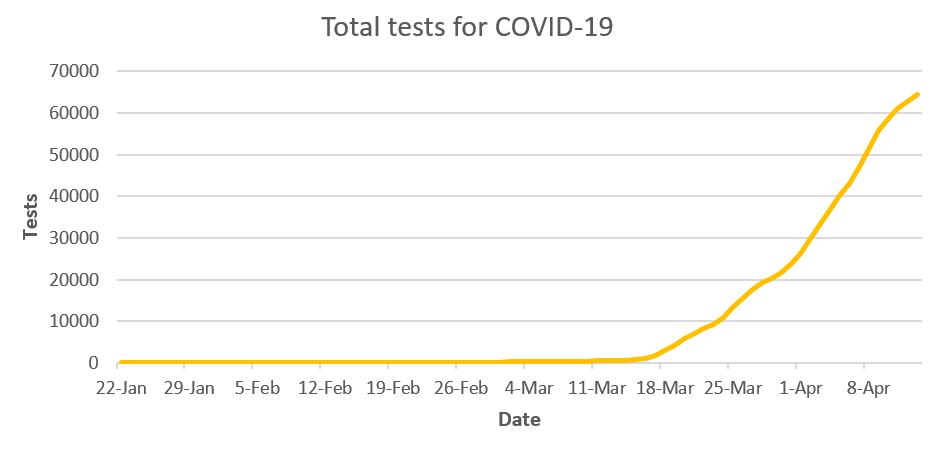
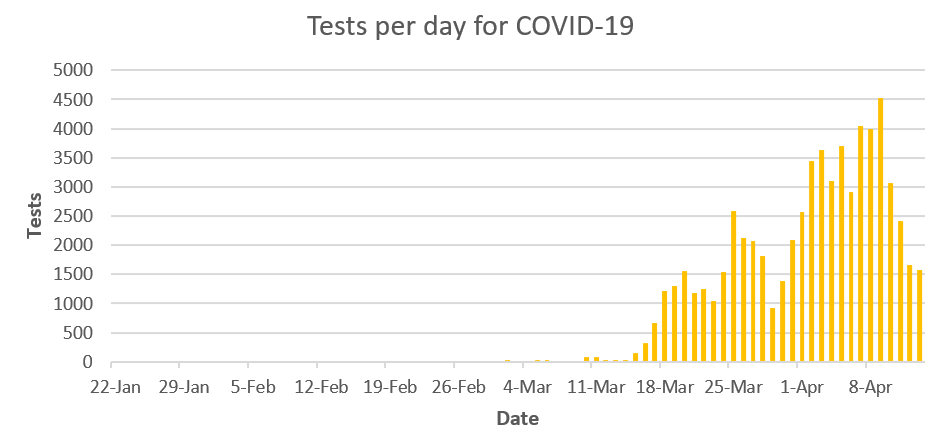
COVID-19 – tests by day and cumulative
| Date | Tests per day | Total tests (cumulative) |
|---|---|---|
| 22 Jan – 8 Mar | 300 | |
| 9-Mar | 12 | 312 |
| 10-Mar | 89 | 401 |
| 11-Mar | 83 | 484 |
| 12-Mar | 31 | 515 |
| 13-Mar | 35 | 550 |
| 14-Mar | 34 | 584 |
| 15-Mar | 142 | 726 |
| 16-Mar | 325 | 1051 |
| 17-Mar | 659 | 1710 |
| 18-Mar | 1209 | 2919 |
| 19-Mar | 1291 | 4210 |
| 20-Mar | 1554 | 5764 |
| 21-Mar | 1176 | 6940 |
| 22-Mar | 1256 | 8196 |
| 23-Mar | 1050 | 9246 |
| 24-Mar | 1544 | 10790 |
| 25-Mar | 2592 | 13382 |
| 26-Mar | 2117 | 15499 |
| 27-Mar | 2067 | 17566 |
| 28-Mar | 1809 | 19375 |
| 29-Mar | 918 | 20293 |
| 30-Mar | 1391 | 21684 |
| 31-Mar | 2093 | 23777 |
| 1-Apr | 2562 | 26339 |
| 2-Apr | 3446 | 29785 |
| 3-Apr | 3631 | 33416 |
| 4-Apr | 3093 | 36509 |
| 5-Apr | 3709 | 40218 |
| 6-Apr | 2908 | 43126 |
| 7-Apr | 4049 | 47175 |
| 8-Apr | 3990 | 51165 |
| 9-Apr | 4520 | 55685 |
| 10-Apr | 3061 | 58746 |
| 11-Apr | 2421 | 61167 |
| 12-Apr | 1660 | 62827 |
| 13-Apr | 1572 | 64399 |
Note: Two sets of cumulative test data have been reconciled to give cumulative total from 22 January 2020 when testing began.


