
Table of Contents

We are at Level 3 of New Zealand’s four-level COVID-19 alert system.
New Zealand moved to Alert Level 3 at 11:59pm on Monday 27 April.
We will stay in Alert Level 3 for two weeks, before Cabinet reviews how we are tracking and makes further decisions on 11 May.
At Alert Level 3 we must be vigilant. We can keep working together to unite against COVID-19 by sticking to the rules.
Government COVID-19 Response Briefing
The All of Government COVID-19 National Response will provide an update at 1.00 pm today.
Speakers:
- Dr Ashley Bloomfield, Director-General of Health.
Ministry of Health Update:
- There are no cases
- One probable case has been reclassified as confirmed.
- There is no change to the confirmed and probable cases 1487
- 2473 tests yesterday, 152,696 total
- 1276 cases recovered
- Seven in hospital, none in ICU.
- Still claiming heaps of flu vaccine, More than 1.3 million flu vaccines have been distributed. This is a record.
- Still proof of non-delivery of vaccine
- Challenges around distribution of stock, but Bloomfield says GPs and pharmacies can get in touch with local distributor to get vaccine.
- We now have zero cases. Why level 3 for full two weeks? Bloomfield says they are still wanting to be sure there is no undetected community transmission. More detailed advice has been given in the area around testing and incubation period of the virus. Towards the end of the week, they will know more.Very important we maintain how we’re currently going, he says.
- Police didn’t raise issues around around legal powers to enforce lockdown. Section 70 notices issued were to provide sound legal basis, including police powers to enforce lockdown.
| Total | Change in last 24 hours | |
|---|---|---|
| Number of confirmed cases in New Zealand | 1,137 | 1 |
| Number of probable cases | 350 | -1 |
| Number of confirmed and probable cases | 1,487 | 0 |
| Number of cases currently in hospital | 4 | -4 |
| Number of recovered cases | 1,276 | 10 |
| Number of deaths | 20 | 0 |
About the data:
- Source: This is provisional information taken daily at 9am from a live database, EpiSurv (ESR) and is likely to change as more details are provided about individual cases.
- Confirmed cases are people that have had a positive laboratory test. For more details please refer to Case definition of COVID-19 infection.
- A probable case is one without a positive laboratory result, but which is treated like a confirmed case based on its exposure history and clinical symptoms.
- Recovered cases are people who had the virus, are at least 10 days since onset and have not exhibited symptoms for 48 hours, and have been cleared by the health professional responsible for their monitoring.
View details of confirmed and probable cases.
View details of significant COVID-19 clusters.
View data for testing rates by ethnicity and DHB.
View interactive map and dashboard.
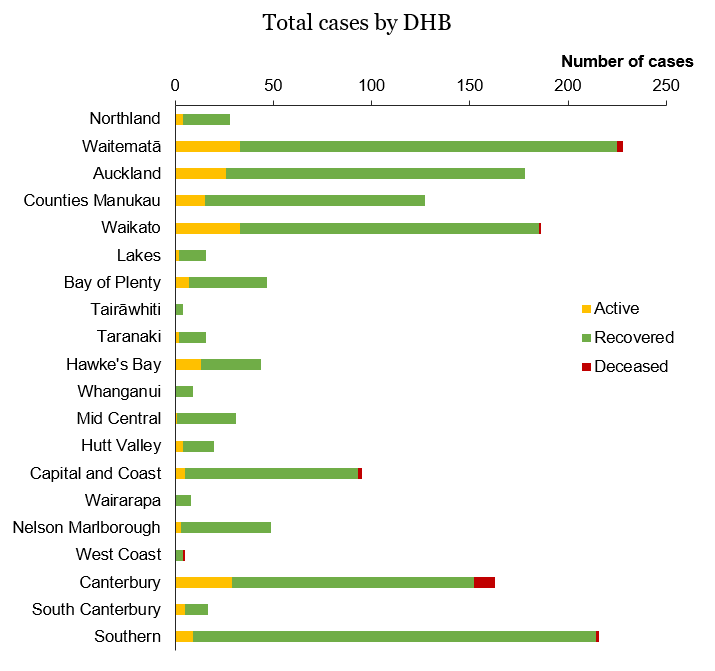
Confirmed and probable cases by DHB
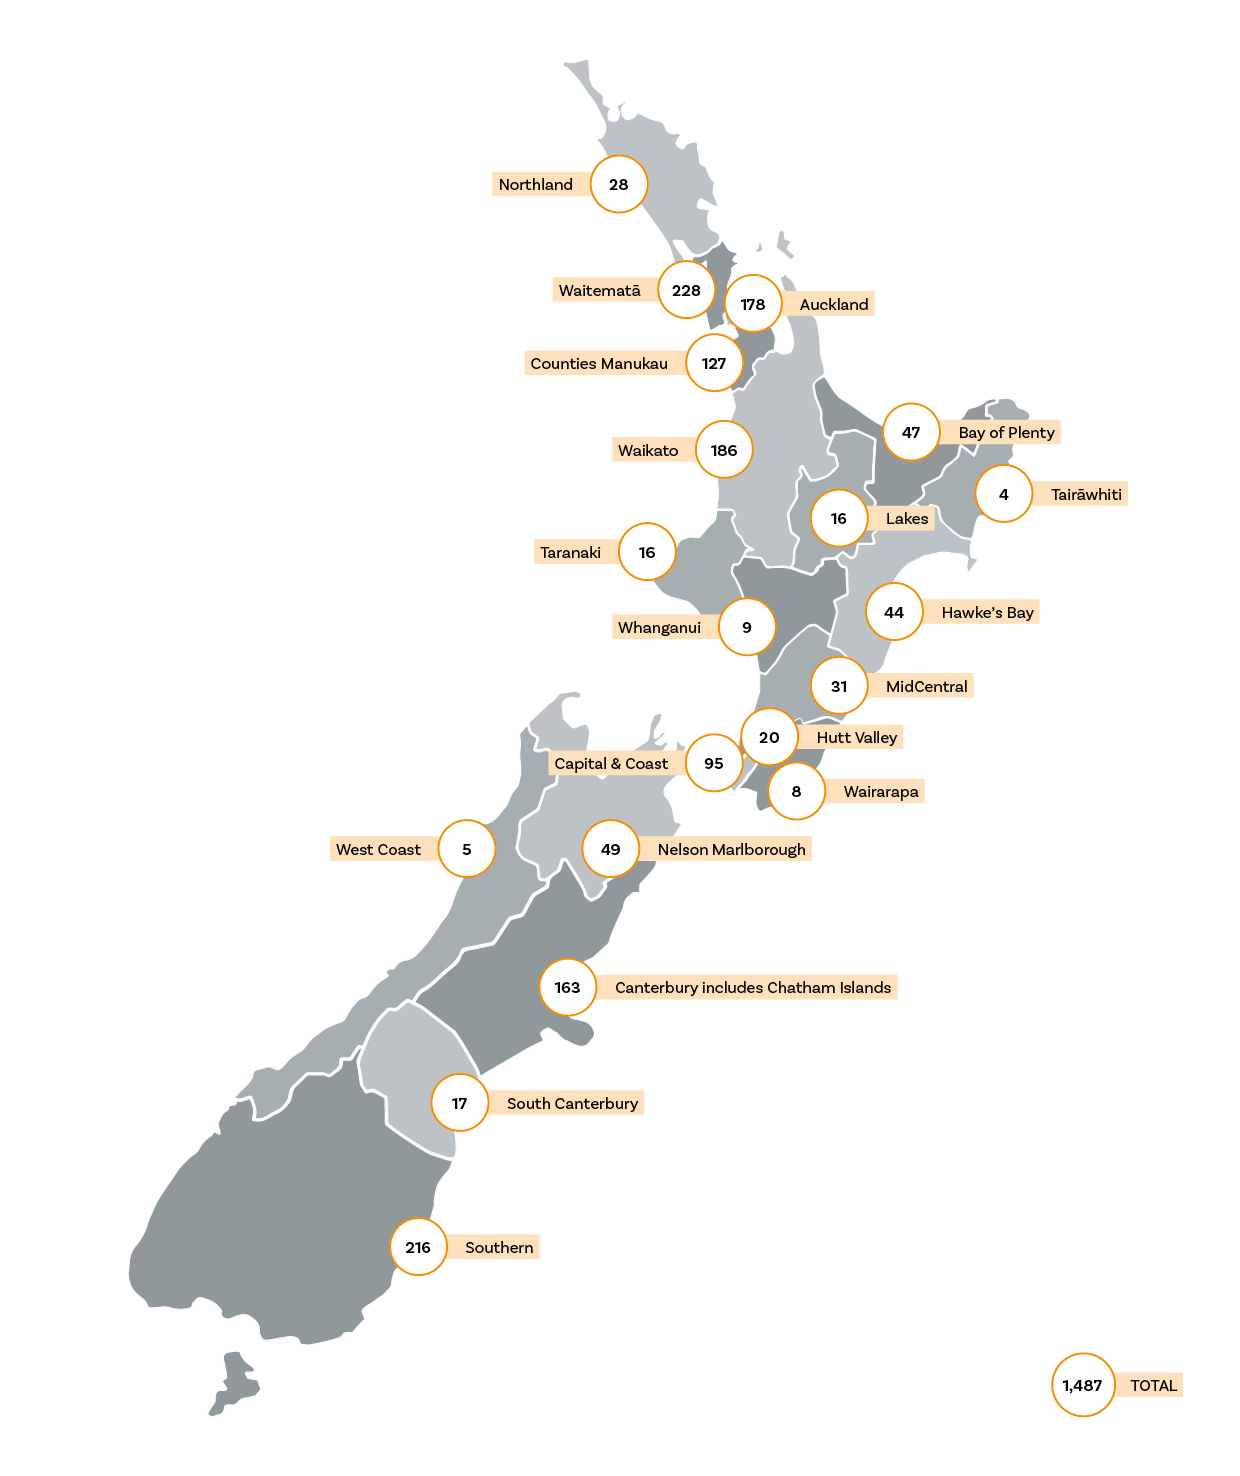
Download the Map of confirmed and probable cases by DHB (PDF, 282 KB).
Total cases by Region
| DHB | Active | Recovered | Deceased | Total | Change in last 24 hours |
|---|---|---|---|---|---|
| Auckland | 26 | 152 | 178 | 0 | |
| Bay of Plenty | 7 | 40 | 47 | 0 | |
| Canterbury | 29 | 123 | 11 | 163 | 0 |
| Capital and Coast | 5 | 88 | 2 | 95 | 0 |
| Counties Manukau | 15 | 112 | 127 | 0 | |
| Hawke’s Bay | 13 | 31 | 44 | 0 | |
| Hutt Valley | 4 | 16 | 20 | 0 | |
| Lakes | 2 | 14 | 16 | 0 | |
| Mid Central | 1 | 30 | 31 | 0 | |
| Nelson Marlborough | 3 | 46 | 49 | 0 | |
| Northland | 4 | 24 | 28 | 0 | |
| South Canterbury | 5 | 12 | 17 | 0 | |
| Southern | 9 | 205 | 2 | 216 | 0 |
| Tair?whiti | 0 | 4 | 4 | 0 | |
| Taranaki | 2 | 14 | 16 | 0 | |
| Waikato | 33 | 152 | 1 | 186 | 0 |
| Wairarapa | 0 | 8 | 8 | 0 | |
| Waitemat? | 33 | 192 | 3 | 228 | 0 |
| West Coast | 0 | 4 | 1 | 5 | 0 |
| Whanganui | 0 | 9 | 9 | 0 | |
| Total | 191 | 1276 | 20 | 1487 | 0 |
Total cases by DHB in hospital
| DHB | Total cases |
|---|---|
| Auckland | 2 |
| Counties Manukau | 1 |
| South Canterbury | 1 |
| Total | 4 |
Note: No cases are in ICU as at 9:00am 4 May 2020.
4 May: Subsequent to today’s media conference, the Ministry has provided updated information that four people are currently in hospital with COVID-19.
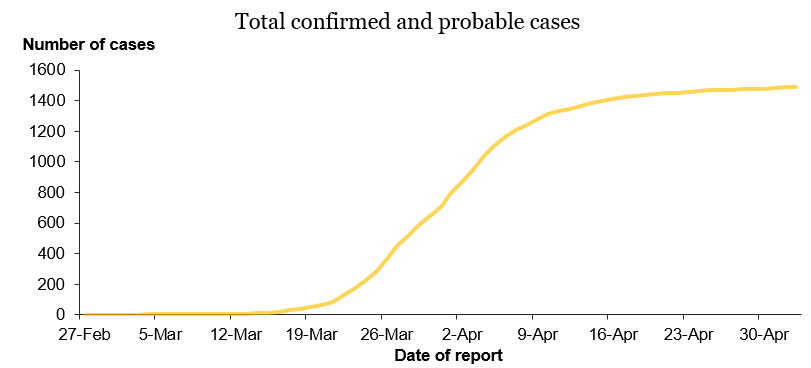
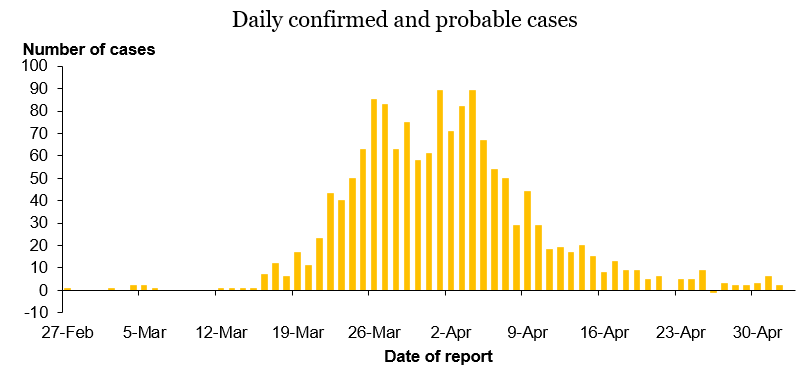
Epidemic Curve
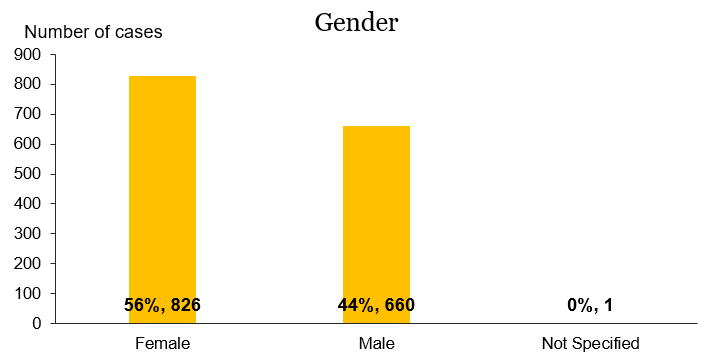
Total Cases by Age and Gender
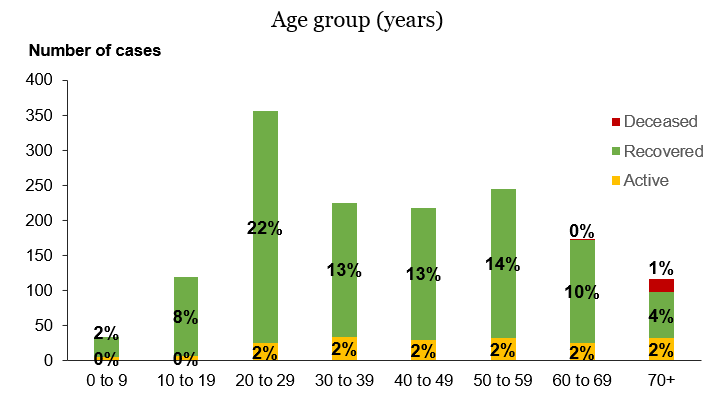
| Age Group | Active | Recovered | Deceased | Total |
|---|---|---|---|---|
| 0 to 9 | 6 | 28 | 34 | |
| 10 to 19 | 7 | 112 | 119 | |
| 20 to 29 | 25 | 331 | 356 | |
| 30 to 39 | 34 | 191 | 225 | |
| 40 to 49 | 30 | 188 | 218 | |
| 50 to 59 | 32 | 213 | 245 | |
| 60 to 69 | 25 | 147 | 2 | 174 |
| 70+ | 32 | 66 | 18 | 116 |
| Total | 191 | 1276 | 20 | 1487 |
Ethnicity percentages of all cases
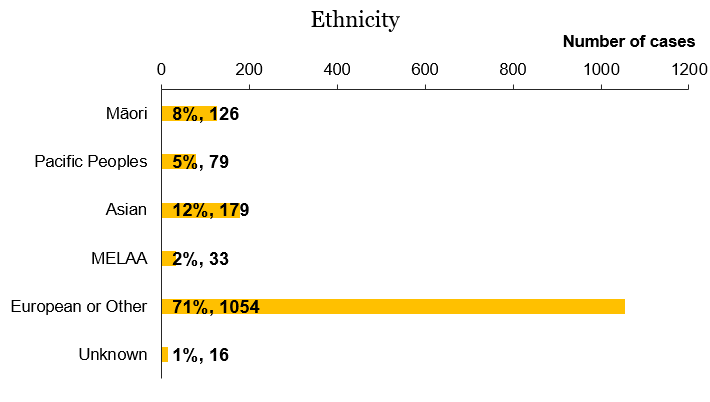
Note: A person who identifies with more than one ethnic group is allocated to a single ethnic group in the following order of priority: Maori, Pacific, Asian and European/Other.
For a detailed break down of ethnicity and DHB region testing see Testing by region.
Transmission
| Transmission type | % of cases |
|---|---|
| Imported cases | 38% |
| Imported related cases | 32% |
| Locally acquired cases, epidemiologically linked | 24% |
| Locally acquired cases, unknown source | 4% |
| Source under investigation | 1% |
Source: ESR EpiSurv extract as at 09:00 4 May 2020
Please note that ESR has changed the source definitions, cases have been classified by source of infection as follows:
- Imported cases: Cases with a reported history of international travel within 14 days of onset.
- Imported related cases: Cases that have a reported link (close contact or epidemiological link) to an imported/overseas acquired case.
- Locally acquired cases, epidemiologically linked: Cases that have a reported link (close contact or other epidemiological link) to a locally acquired case with unknown source.
- Locally acquired cases, unknown source: Cases that have no reported history of international travel within 14 days of onset and no recorded epidemiological link to a source case.
- Source of infection remains under investigation whereby source of infection could not be classified due to incomplete EpiSurv case report forms. These cases are removed from further analyses in the sections below.
Lab testing and capacity
| Tests | Date | |
|---|---|---|
| Total tested yesterday | 2,473 | 3 May 2020 |
| 7-day rolling average | 4,111 | 27 April to 3 May 2020 |
| Total tested to date | 152,696 | 22 January to 3 May 2020 |
| Supplies in stock | 58,614 | 4 May 2020 |
View a detailed break down of testing by region.
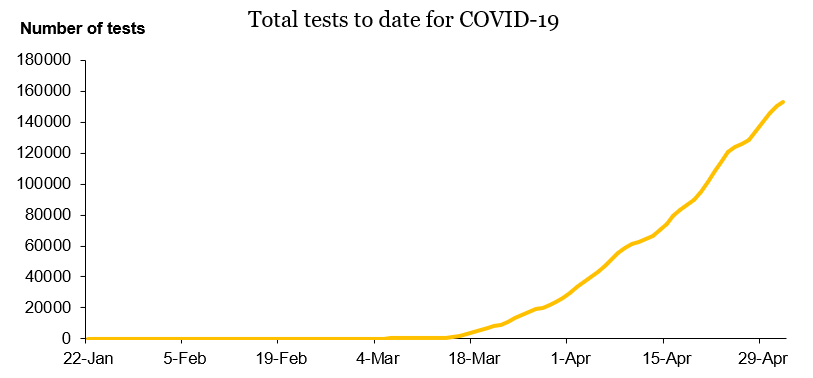
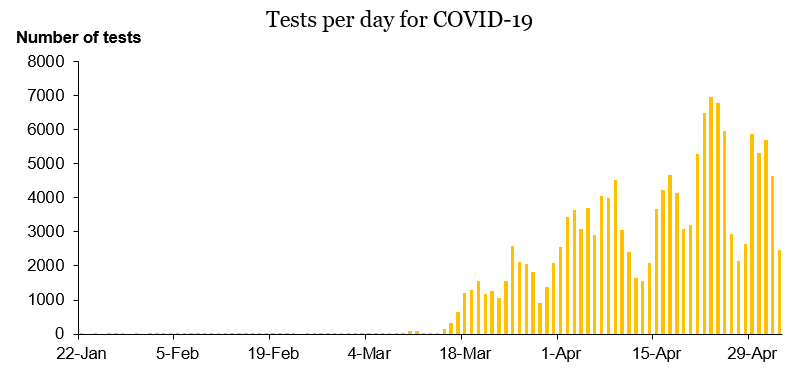
COVID-19 – tests by day and cumulative
| Date | Tests per day | Total tests (cumulative) |
|---|---|---|
| 22 Jan – 8 Mar | 300 | |
| 9-Mar | 12 | 312 |
| 10-Mar | 89 | 401 |
| 11-Mar | 83 | 484 |
| 12-Mar | 31 | 515 |
| 13-Mar | 35 | 550 |
| 14-Mar | 34 | 584 |
| 15-Mar | 142 | 726 |
| 16-Mar | 325 | 1051 |
| 17-Mar | 659 | 1710 |
| 18-Mar | 1209 | 2919 |
| 19-Mar | 1291 | 4210 |
| 20-Mar | 1554 | 5764 |
| 21-Mar | 1176 | 6940 |
| 22-Mar | 1256 | 8196 |
| 23-Mar | 1050 | 9246 |
| 24-Mar | 1544 | 10790 |
| 25-Mar | 2592 | 13382 |
| 26-Mar | 2117 | 15499 |
| 27-Mar | 2067 | 17566 |
| 28-Mar | 1809 | 19375 |
| 29-Mar | 918 | 20293 |
| 30-Mar | 1391 | 21684 |
| 31-Mar | 2093 | 23777 |
| 1-Apr | 2562 | 26339 |
| 2-Apr | 3446 | 29785 |
| 3-Apr | 3631 | 33416 |
| 4-Apr | 3093 | 36509 |
| 5-Apr | 3709 | 40218 |
| 6-Apr | 2908 | 43126 |
| 7-Apr | 4049 | 47175 |
| 8-Apr | 3990 | 51165 |
| 9-Apr | 4520 | 55685 |
| 10-Apr | 3061 | 58746 |
| 11-Apr | 2421 | 61167 |
| 12-Apr | 1660 | 62827 |
| 13-Apr | 1572 | 64399 |
| 14-Apr | 2100 | 66499 |
| 15-Apr | 3661 | 70160 |
| 16-Apr | 4241 | 74401 |
| 17-Apr | 4677 | 79078 |
| 18-Apr | 4146 | 83224 |
| 19-Apr | 3081 | 86305 |
| 20-Apr | 3203 | 89508 |
| 21-Apr | 5289 | 94797 |
| 22-Apr | 6480 | 101277 |
| 23-Apr | 6961 | 108238 |
| 24-Apr | 6777 | 115015 |
| 25-Apr | 5966 | 120981 |
| 26-Apr | 2939 | 123920 |
| 27-Apr | 2146 | 126066 |
| 28-Apr | 2637 | 128703 |
| 29-Apr | 5867 | 134570 |
| 30-Apr | 5328 | 139898 |
| 1-May | 5691 | 145589 |
| 2-May | 4634 | 150223 |
| 3-May | 2473 | 152696 |
Note: Two sets of cumulative test data have been reconciled to give cumulative total from 22 January 2020 when testing began.


