Table of Contents
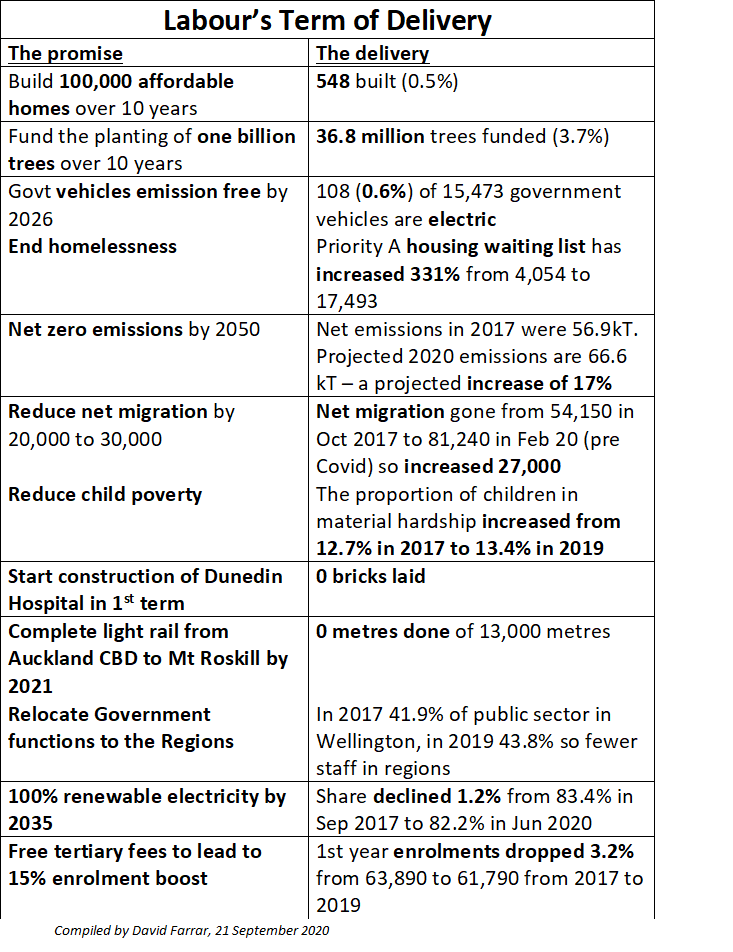
David Farrar has provided a handy list of Labour’s massive policy and delivery failures from the past three years.
| The promise | The delivery |
| Build 100,000 affordable homes over 10 years | 548 built (0.5%) |
| Fund the planting of one billion trees over 10 years | 36.8 million trees funded (3.7%) |
| Govt vehicles emission free by 2026 | 108 (0.6%) of 15,473 government vehicles are electric |
| End homelessness | Priority A housing waiting list has increased 331% from4,054 to 17,493 |
| Net zero emissions by 2050 | Net emissions in 2017 were 56.9kT. Projected 2020 emissions are 66.6 kT – a projected increase of 17% |
| Reduce net migration by 20,000 to 30,000 | Net migration gone from 54,150 in Oct 2017 to 81,240 in Feb 20 (pre Covid) so increased 27,000 |
| Reduce child poverty | The proportion of children in material hardship increased from 12.7% in 2017 to 13.4% in 2019 |
| Start construction of Dunedin Hospital in 1st term | 0 bricks laid |
| Complete light rail from Auckland CBD to Mt Roskill by 2021 | 0 metres done of 13,000 metres |
| Relocate Government functions to the Regions | In 2017 41.9% of public sector in Wellington, in 2019 43.8% so fewer staff in regions |
| 100% renewable electricity by 2035 | Share declined 1.2% from 83.4% in Sep 2017 to 82.2% in Jun 2020 |
| Free tertiary fees to lead to 15% enrolment boost | 1st year enrolments dropped 3.2% from 63,890 to 61,790 from 2017 to 2019 |
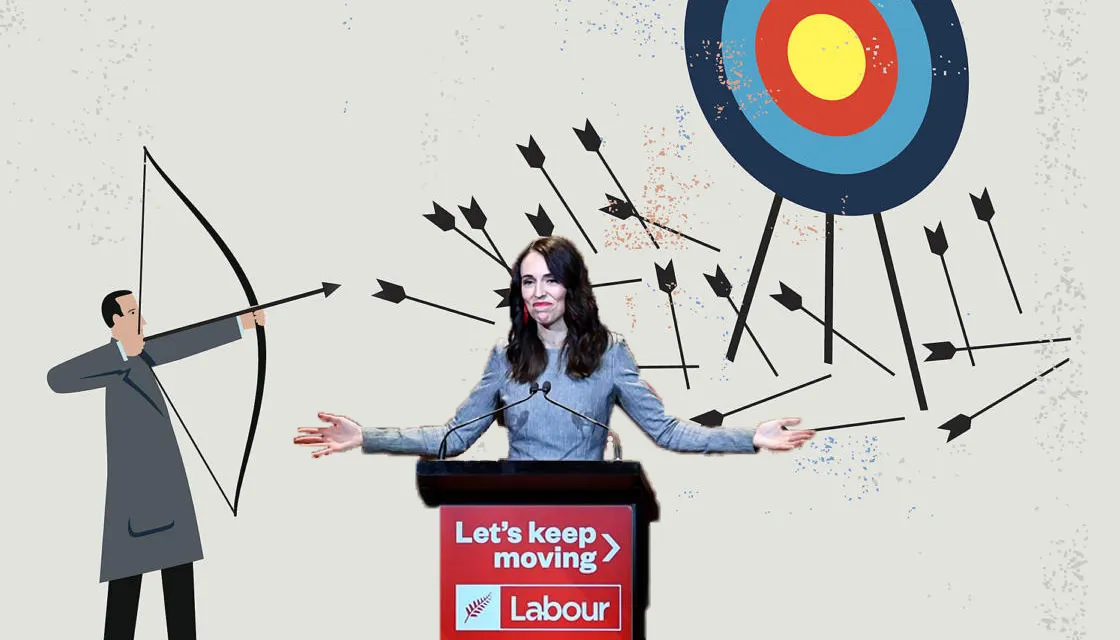
This is gross incompetence from the Government. They didn’t narrowly miss a few targets, they missed them by a proverbial country mile. In shooting parlance, they aren’t even on the paper. Some metrics have actually gone backwards.
It makes a mockery of their campaign slogan, “Let’s Keep Moving”. In many regards, it would have been nice if they’d actually put the vehicle into gear and depressed the accelerator. Instead, they had the hand brake on as well as a few sacks of cement on the brake pedal.
Farrar has provided a handy graphic to share on social media, or you could just share this article:
And just in case anyone thinks he is making this up, here are his references for the statistics:
References
- Kiwibuild – https://www.hud.govt.nz/news-and-resources/statistics-and-research/government-build-programme-housing-dashboard/
- Trees – https://www.mpi.govt.nz/funding-and-programmes/forestry/one-billion-trees-programme/about-the-one-billion-trees-programme/
- Migration – Stats NZ Infoshare Table ITM399AA
- Electric vehicles – https://www.procurement.govt.nz/broader-outcomes/reducing-emissions-and-waste/reducing-government-fleet-emissions/
- Housing – https://msd.govt.nz/about-msd-and-our-work/publications-resources/statistics/housing/index.html and https://twitter.com/henrycooke/status/1307827326407770112
- Climate Change – https://www.mfe.govt.nz/climate-change/emissions-reduction-targets/projected-emissions
- Child Poverty – https://www.stats.govt.nz/information-releases/child-poverty-statistics-year-ended-june-2019
- Govt workforce – https://www.publicservice.govt.nz/our-work/workforce-data/public-service-workforce-by-region/
- Electricity – https://www.mbie.govt.nz/building-and-energy/energy-and-natural-resources/energy-statistics-and-modelling/energy-statistics/electricity-statistics/
- Tertiary Education – https://www.educationcounts.govt.nz/statistics/tertiary-education/participation
If you enjoyed this BFD article please share it.
