Table of Contents
by JurijFedorov:
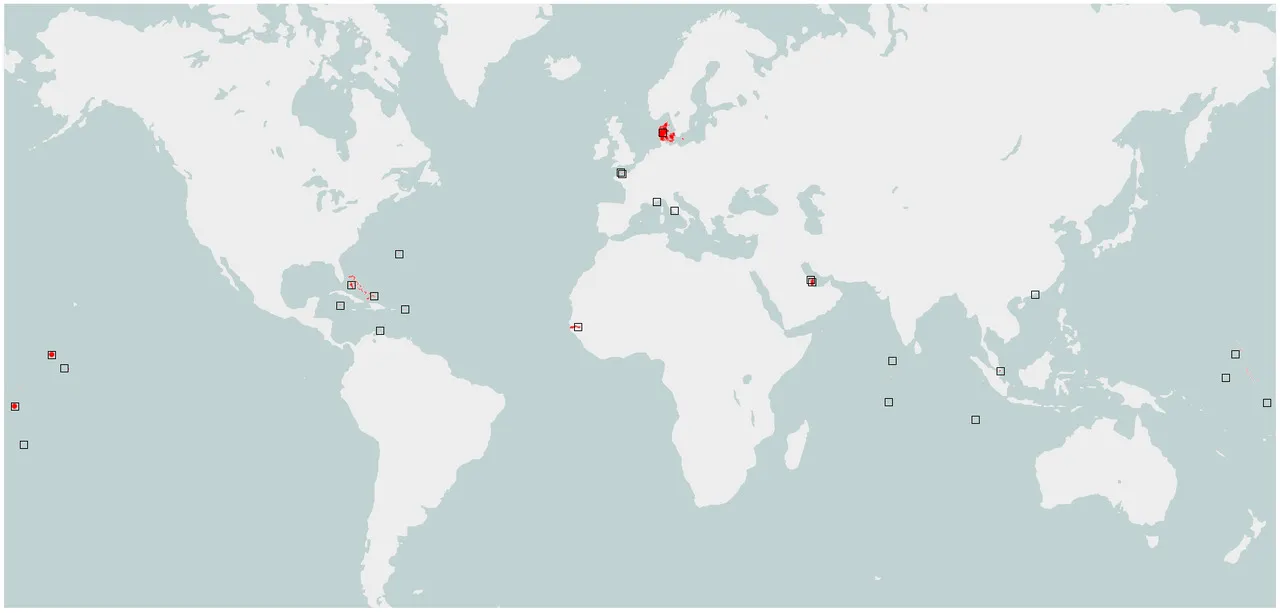
2 islands are shown as red circles which Tableau did automatically. I didn’t want that to happen.
Source:https://en.wikipedia.org/wiki/List_of_elevation_extremes_by_country
Here is the interactive chart. You can play around with the numbers there:
https://public.tableau.com/views/Elevationextremesbycountry/Maximumelevation?:embed=y&:display_count=yes&:origin=viz_share_link
(Source: reddit.com)


