Table of Contents

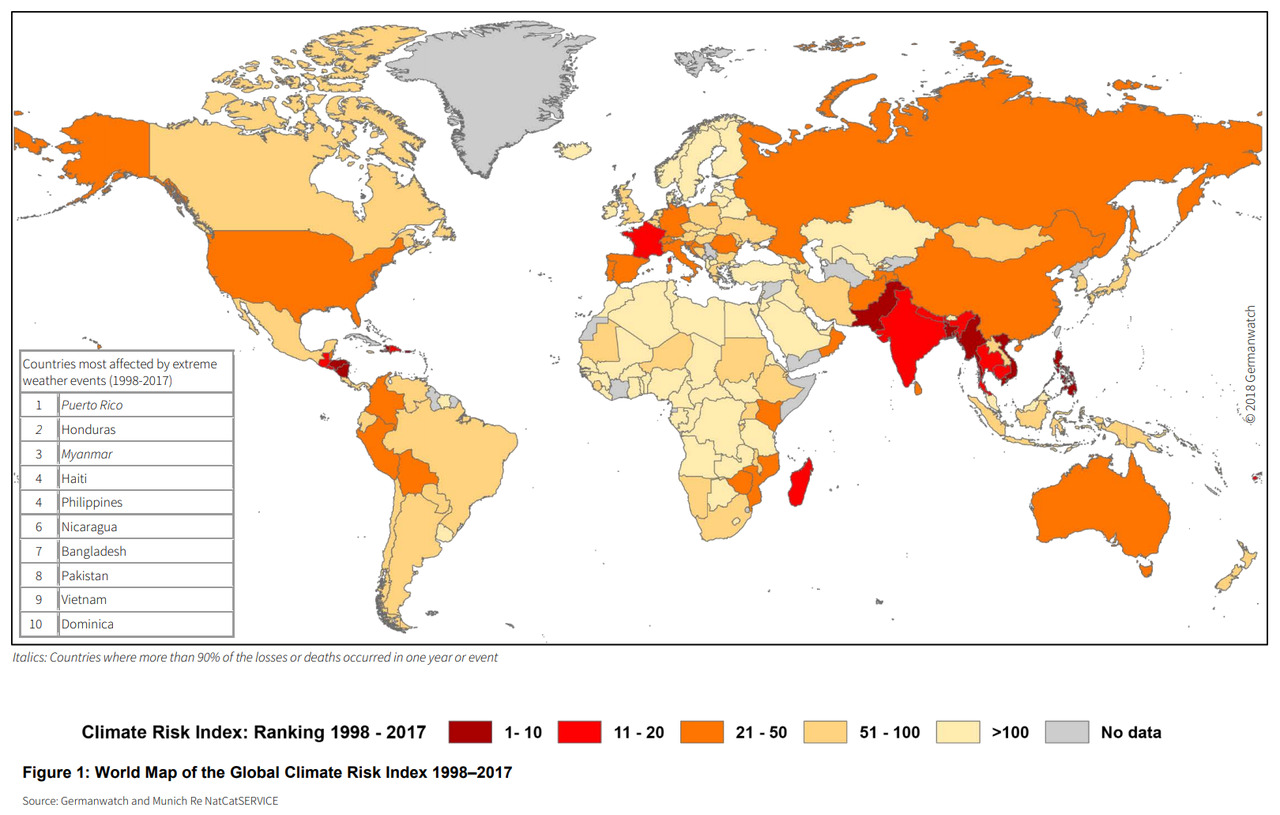
The Germanwatch Global Climate Risk Index is an analysis based on one of the most reliable data sets available on the impacts of extreme weather events and associated socio-economic data. The Germanwatch Climate Risk Index 2019 is the 14th edition of the annual analysis. Its aim is to contextualize ongoing climate policy debates – especially the international climate negotiations – with real-world impacts during the last year and the last 20 years.
However, the index must not be mistaken for a comprehensive climate vulnerability scoring. It represents one important piece in the overall puzzle of climate-related impacts and associated vulnerabilities but, for example, does not take into account important aspects such as rising sea-levels, glacier melting or more acidic and warmer seas.
It is based on past data and should not be used for a linear projection of future climate impacts. Specifically, not too far-reaching conclusions should be drawn for political discussions regarding which country or region is the most vulnerable to climate change. Also, it is important to note that the occurrence of a single extreme event cannot be easily attributed to anthropogenic climate change. Nevertheless, climate change is an increasingly important factor for changing the likelihood of occurrence and the intensity of these events. There is a growing body of research that is looking into the attribution of the risk of extreme events to the influences of climate change.
The Climate Risk Index (CRI) indicates a level of exposure and vulnerability to extreme events, which countries should understand as warnings in order to be prepared for more frequent and/or more severe events in the future. Not being mentioned in the CRI does not mean there are no impacts occurring in these countries. Due to the limitations of the available data, particularly long-term comparative data, including socio-economic data, some very small countries, such as certain small island states, are not included in this analysis. Moreover, the data only reflects the direct impacts (direct losses and fatalities) of extreme weather events, whereas, for example, heat waves – which are a frequent occurrence in African countries – often lead to much stronger indirect impacts (e.g. as a result of droughts and food scarcity). Finally, the index does not include the total number of affected people (in addition to the fatalities) since the comparability of such data is very limited.
Source: germanwatch.org)


