Table of Contents
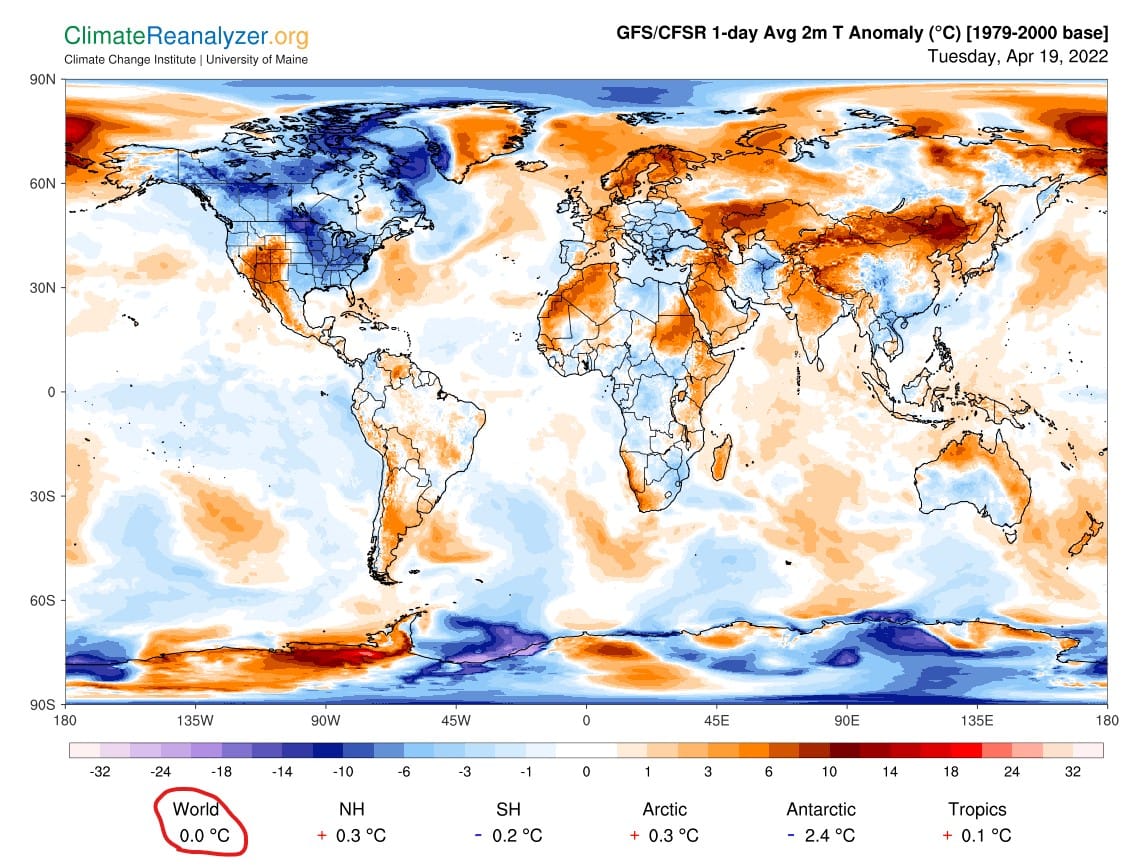
On April 19 2022 the runaway catastrophic anthropogenic global warming temperature anomaly had reached the dizzying heights of exactly 0.0 °C above the long term average temperatures on April 19 for the period 1979–2000.
Don’t believe me? I have proof from the Climate Change Institute at the University of Maine and they use data from the NOAA Global Forecast System. You cannot get more mainstream and serious than that! This is no crackpot conspiracy theory, no siree!
This is genuine science. Here is what they say:
2m Temperature refers to air temperature at 2 meters above the surface. 2m Temperature Anomaly refers to the departure of the current day’s forecasted temperature from a long-term mean for the same day of the year. The anomalies here are based on a 1979-2000 reference climatology derived from the NCEP Climate Forecast System Reanalysis (CFSR). This 22-year baseline is used instead of the more common 1981-2010 climate normal because 1979-2000 represents conditions prior to rapid Arctic warming and sea-ice loss.
https://climatereanalyzer.org/
And this was the result for 19 April 2022.

How can this be? Are we not told that we are reaching a tipping point beyond which we shall never recover? 1.5 °C and all that? (Or was it 2 °C?)
Unfortunately, one needs to read the fine print …
Weather maps on this page depict output from the operational NOAA Global Forecast System (GFS)model
. GFS utilizes a 13 km Finite-Volume Cubed-Sphere dynamical core (FV3) to produce 16-day forecasts 4x daily
The pretty picture is the output of a climate model!
All those angry red blobs of runaway warming and the freezing cold blue blobs exist only in a computer, they have no relevance to what is happening on the ground (or 2 m above it) anywhere!
To the nearest 0.1 °C, what do you think the temperature is within a 13 km Finite-Volume Cubed-Sphere around your measurement thermometer?
And we are supposed to trash our economy because of this sort of “Science”?


