
Table of Contents
Lindsay Mitchell
Lindsay Mitchell has been researching and commenting on welfare since 2001. Many of her articles have been published in mainstream media and she has appeared on radio, tv and before select committees discussing issues relating to welfare. Lindsay is also an artist who works under commission and exhibits at Wellington, New Zealand, galleries.
Am I the only person who has read MSD’s latest annual report?
It’s a tedious business but surely a few checkers cast their eyes over it prior to publication.
I was casting my own over the benefit statistics by region when I stopped in my tracks.
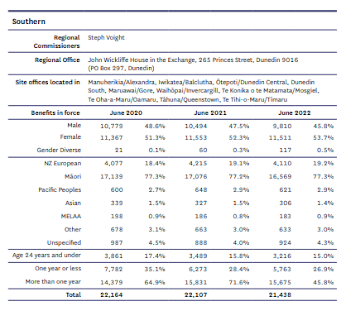
According to the above table 77.3% of people on benefits in June 2022 in the Southern region (which encompasses Dunedin, Central Otago and Invercargill) were Maori.
That’s extraordinary.
I checked the other two South Island regions – Canterbury and Nelson-Marlborough-West Coast – to find similar proportions at respectively 71.2 and 77.7 %
This is astounding news to me. Maori make up 17 per cent of the population nationally but lower percentages in the South Island. For instance, at the last census only 9.4% of the Canterbury population identified as Maori.
When a statistic is so out of whack the obvious recourse is to check it against another source.
MSD regional data for Canterbury June 2022 shows Maori made up just 21.1% of all people on benefits whereas NZ European accounted for 71.2 per cent.
The data has been inverted.
But the error isn’t even consistent.
There are eleven regions and tables contained in the annual report.
The data is correct for just three – Northland, Auckland and Waikato.
What surprises me is that even faint familiarity with MSD data would set off alarm bells. It is simply implausible that 77 per cent of beneficiaries in the Southern region are Maori.
If that’s wrong what else might be?
I returned to the table above and took another look. Apparently, 26.9 per cent of beneficiaries in the Southern region have been on a benefit for one year or less; 45.8 per cent for more than one year. That sums to 72.7 per cent.
What about the rest?
Of course, this could all be dismissed as trivial errors.
But if funding is to be race-based in any manner then accurate numbers are extremely important.
The idea is bad enough. Poor execution of it is salt in the wound.


