
Table of Contents

We are at Level 3 of New Zealand’s four-level COVID-19 alert system.
New Zealand moved to Alert Level 3 at 11:59pm on Monday 27 April.
We will stay in Alert Level 3 for two weeks, before Cabinet reviews how we are tracking and makes further decisions on 11 May.
At Alert Level 3 we must be vigilant. We can keep working together to unite against COVID-19 by sticking to the rules.
Government COVID-19 Response Briefing
The Minister of Finance Grant Robertson and Director of Public Health Dr Caroline McElnay will provide a COVID-19 update at 1.00 pm today.
Ministry of Health Update:
- 3 new confirmed cases, probable cases
- 1479 total cases
- 1132 cases reported to WHO
- 5328 tests yesterday
- 139898 total tests
- 1252 recovered
- 85% considered to be recovered
- 6 in hospital, none in ICU
- 16 clusters, 1 has had no cases for 28 days and is considered closed. Expected to close two more clusters in coming days.
- Waitemata DHB issued a media statement on 3 staff who have tested positive.
- Two of those staff were included in previous totals, one was included in today’s total
- Were caring for St Margaret’s patients
Finance Minister Update:
- 96 new breaches and total of 289 under CDEM or health acts under Level 3
- 77 prosecuted, up 31 on yesterday
- Praising snitch culture
- More that 2300 snitch reports
- 785 reports about individuals under level 3, others about businesses and gatherings.
- There have been an increase in reports about parties.
- Robertson being the party pooper
- Robertson telling people to cancel parties “now”
- Calling people idiots
- The 2020 winter energy payment has been doubled.
- Government providing interest free loans for a year to small to medium sized businesses (50 or fewer staff)
- The scheme has a max 5 years – repayments not required in first two years
- Designed to get immediate help to businesses
Yesterday’s details:
- 3 new confirmed cases
- 1 reclassification
- 1129 cases reported to WHO
- 347 probable
- 1476 total.
- 5800 tests yesterday
- 1241 recovered, more cases recovered than declared to WHO
| Total | Change in last 24 hours | |
|---|---|---|
| Number of confirmed cases in New Zealand | 1,132 | 3 |
| Number of probable cases | 347 | 0 |
| Number of confirmed and probable cases | 1,479 | 3 |
| Number of cases currently in hospital | 6 | -1 |
| Number of recovered cases | 1,252 | 11 |
| Number of deaths | 19 | 0 |
About the data:
- Source: This is provisional information taken daily at 9am from a live database, EpiSurv (ESR) and is likely to change as more details are provided about individual cases.
- Confirmed cases are people that have had a positive laboratory test. For more details please refer to Case definition of COVID-19 infection.
- A probable case is one without a positive laboratory result, but which is treated like a confirmed case based on its exposure history and clinical symptoms.
- Recovered cases are people who had the virus, are at least 10 days since onset and have not exhibited symptoms for 48 hours, and have been cleared by the health professional responsible for their monitoring.
View details of confirmed and probable cases.
View details of significant COVID-19 clusters.
View data for testing rates by ethnicity and DHB.
View interactive map and dashboard.
Confirmed and probable cases by DHB
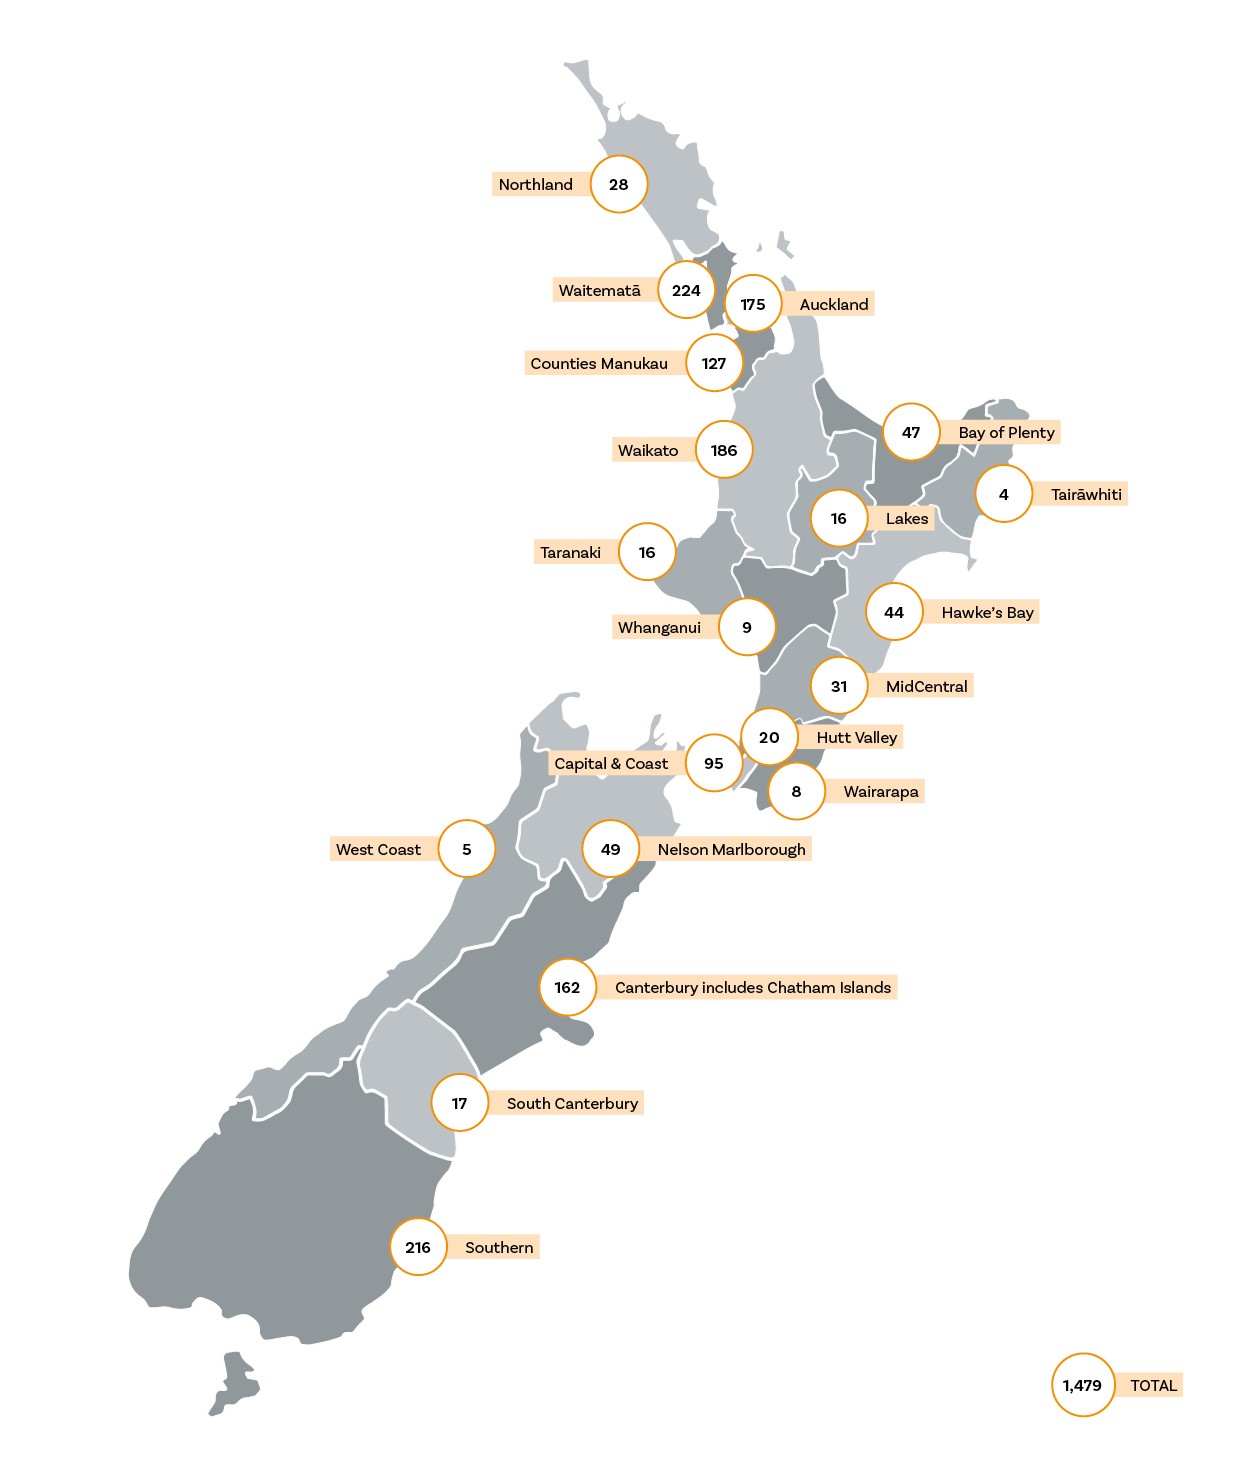
Download the Map of confirmed and probable cases by DHB (PDF, 282 KB).
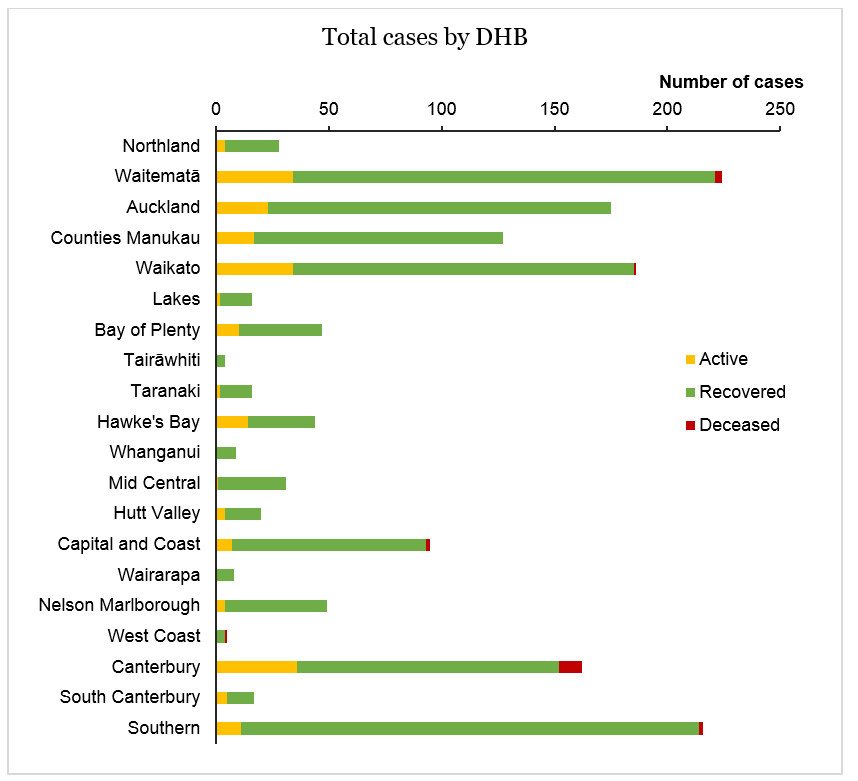
Total cases by Region
| DHB | Active | Recovered | Deceased | Total | Change in last 24 hours |
|---|---|---|---|---|---|
| Auckland | 23 | 152 | 175 | 2 | |
| Bay of Plenty | 10 | 37 | 47 | 0 | |
| Canterbury | 36 | 116 | 10 | 162 | 0 |
| Capital and Coast | 7 | 86 | 2 | 95 | 0 |
| Counties Manukau | 17 | 110 | 127 | 0 | |
| Hawke’s Bay | 14 | 30 | 44 | 0 | |
| Hutt Valley | 4 | 16 | 20 | 0 | |
| Lakes | 2 | 14 | 16 | 0 | |
| Mid Central | 1 | 30 | 31 | 0 | |
| Nelson Marlborough | 4 | 45 | 49 | 0 | |
| Northland | 4 | 24 | 28 | 0 | |
| South Canterbury | 5 | 12 | 17 | 0 | |
| Southern | 11 | 203 | 2 | 216 | 0 |
| Tair?whiti | 0 | 4 | 4 | 0 | |
| Taranaki | 2 | 14 | 16 | 0 | |
| Waikato | 34 | 151 | 1 | 186 | 0 |
| Wairarapa | 0 | 8 | 8 | 0 | |
| Waitemat? | 34 | 187 | 3 | 224 | 1 |
| West Coast | 0 | 4 | 1 | 5 | 0 |
| Whanganui | 0 | 9 | 9 | 0 | |
| Total | 208 | 1252 | 19 | 1479 | 3 |
Total cases in hospital by DHB
| DHB | Total cases |
|---|---|
| Auckland | 2 |
| Bay of Plenty | 1 |
| Counties Manukau | 1 |
| South Canterbury | 1 |
| Waitemat? | 1 |
| Total | 6 |
Note: None are in ICU as at 9:00am 1 May 2020
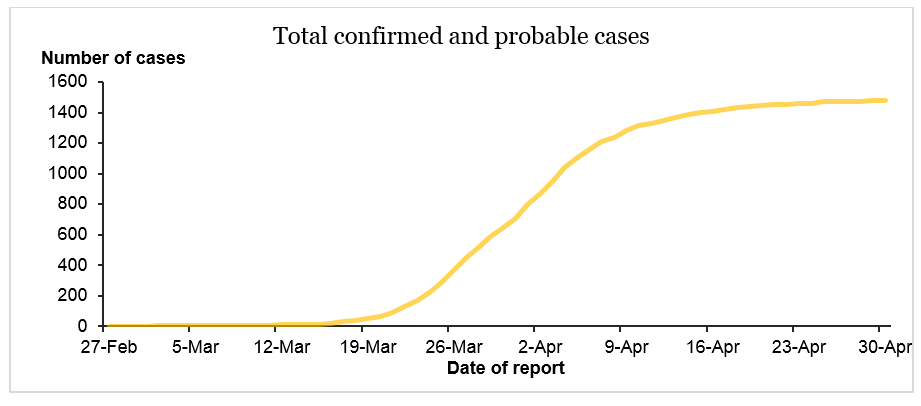
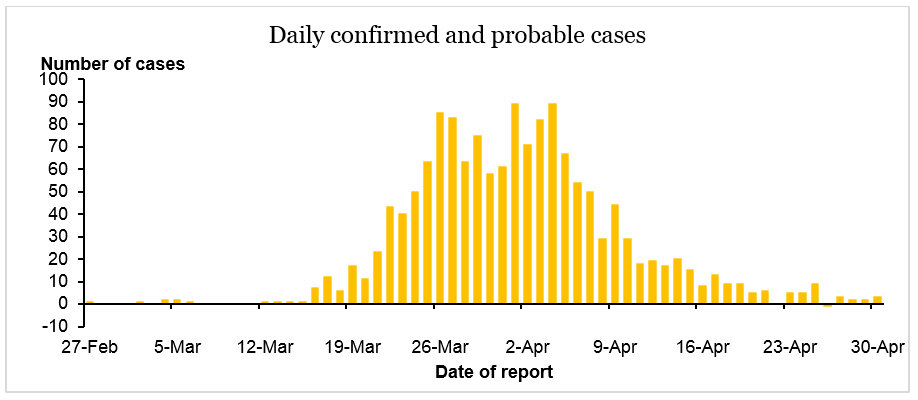
Epidemic Curve
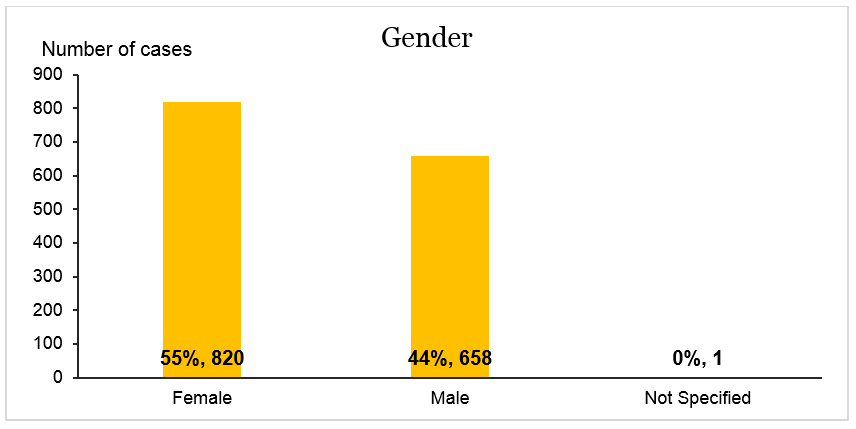
Total Cases by Age and Gender
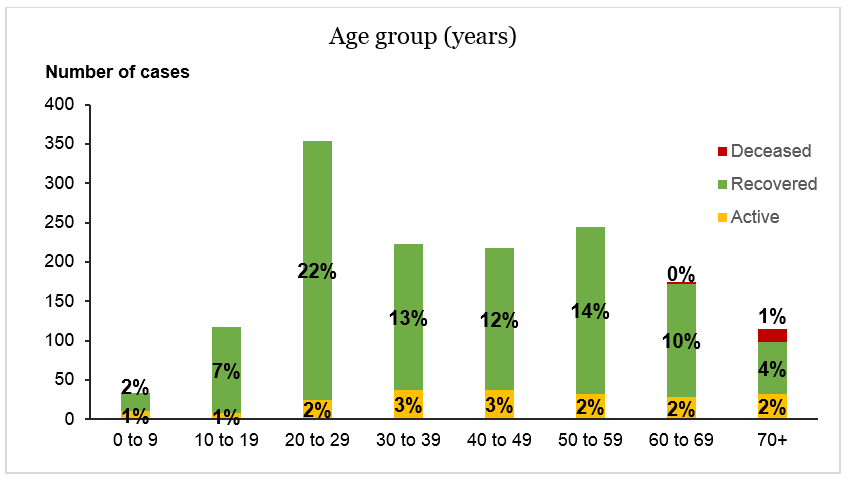
| Age Group | Active | Recovered | Deceased | Total |
|---|---|---|---|---|
| 0 to 9 | 10 | 24 | 34 | |
| 10 to 19 | 8 | 109 | 117 | |
| 20 to 29 | 24 | 330 | 354 | |
| 30 to 39 | 37 | 186 | 223 | |
| 40 to 49 | 37 | 181 | 218 | |
| 50 to 59 | 32 | 212 | 244 | |
| 60 to 69 | 28 | 144 | 2 | 174 |
| 70+ | 32 | 66 | 17 | 115 |
| Total | 208 | 1252 | 19 | 1479 |
Ethnicity percentages of all cases
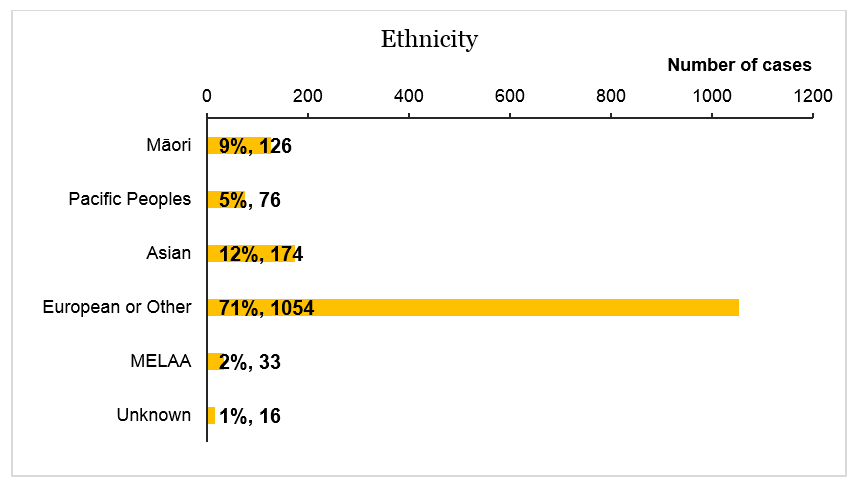
Note: A person who identifies with more than one ethnic group is allocated to a single ethnic group in the following order of priority: Maori, Pacific, Asian and European/Other.
For a detailed break down of ethnicity and DHB region testing see Testing by region.
Transmission
| Transmission type | % of cases |
|---|---|
| Imported cases | 39% |
| Imported related cases | 32% |
| Locally acquired cases, epidemiologically linked | 24% |
| Locally acquired cases, unknown source | 4% |
| Source under investigation | 1% |
Source: ESR EpiSurv extract as at 09:00 1 May 2020
Please note that ESR has changed the source definitions, cases have been classified by source of infection as follows:
- Imported cases: Cases with a reported history of international travel within 14 days of onset.
- Imported related cases: Cases that have a reported link (close contact or epidemiological link) to an imported/overseas acquired case.
- Locally acquired cases, epidemiologically linked: Cases that have a reported link (close contact or other epidemiological link) to a locally acquired case with unknown source.
- Locally acquired cases, unknown source: Cases that have no reported history of international travel within 14 days of onset and no recorded epidemiological link to a source case.
- Source of infection remains under investigation whereby source of infection could not be classified due to incomplete EpiSurv case report forms. These cases are removed from further analyses in the sections below.
Lab testing and capacity
| Tests | Date | |
|---|---|---|
| Total tested yesterday | 5,328 | 30 April 2020 |
| 7-day rolling average | 4,523 | 24 April to 30 April 2020 |
| Total tested to date | 139,898 | 22 January to 30 April 2020 |
| Supplies in stock | 59,266 | 1 May 2020 |
View a detailed break down of testing by region.
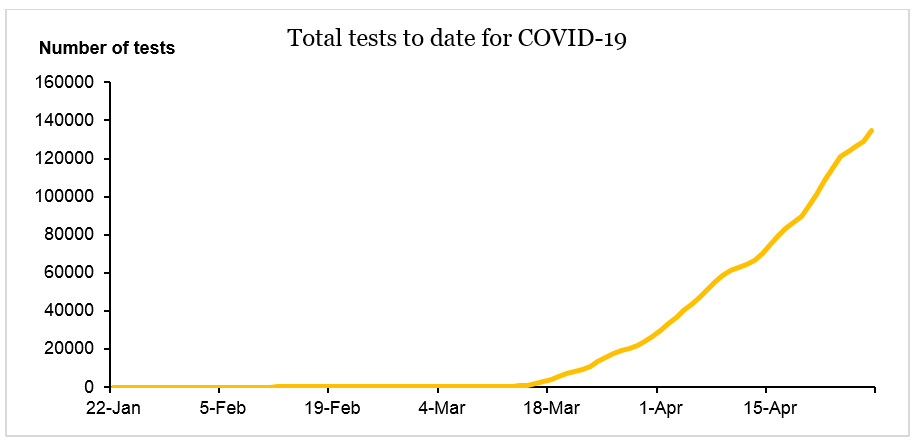
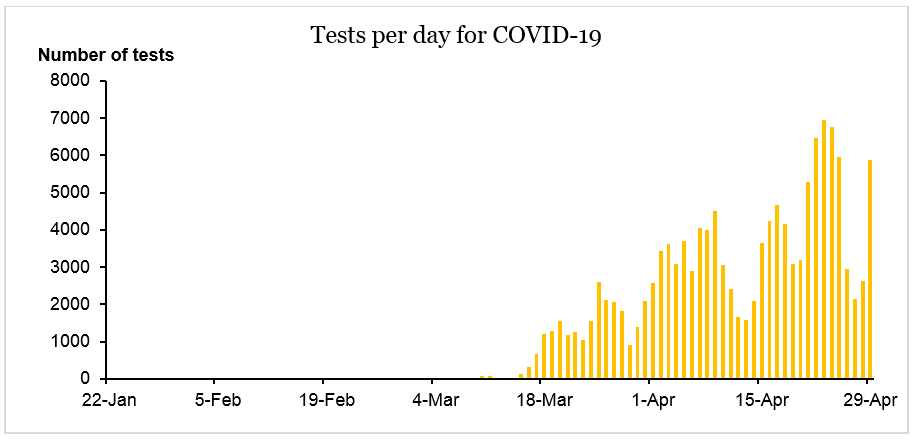
COVID-19 – tests by day and cumulative
| Date | Tests per day | Total tests (cumulative) |
|---|---|---|
| 22 Jan – 8 Mar | 300 | |
| 9-Mar | 12 | 312 |
| 10-Mar | 89 | 401 |
| 11-Mar | 83 | 484 |
| 12-Mar | 31 | 515 |
| 13-Mar | 35 | 550 |
| 14-Mar | 34 | 584 |
| 15-Mar | 142 | 726 |
| 16-Mar | 325 | 1051 |
| 17-Mar | 659 | 1710 |
| 18-Mar | 1209 | 2919 |
| 19-Mar | 1291 | 4210 |
| 20-Mar | 1554 | 5764 |
| 21-Mar | 1176 | 6940 |
| 22-Mar | 1256 | 8196 |
| 23-Mar | 1050 | 9246 |
| 24-Mar | 1544 | 10790 |
| 25-Mar | 2592 | 13382 |
| 26-Mar | 2117 | 15499 |
| 27-Mar | 2067 | 17566 |
| 28-Mar | 1809 | 19375 |
| 29-Mar | 918 | 20293 |
| 30-Mar | 1391 | 21684 |
| 31-Mar | 2093 | 23777 |
| 1-Apr | 2562 | 26339 |
| 2-Apr | 3446 | 29785 |
| 3-Apr | 3631 | 33416 |
| 4-Apr | 3093 | 36509 |
| 5-Apr | 3709 | 40218 |
| 6-Apr | 2908 | 43126 |
| 7-Apr | 4049 | 47175 |
| 8-Apr | 3990 | 51165 |
| 9-Apr | 4520 | 55685 |
| 10-Apr | 3061 | 58746 |
| 11-Apr | 2421 | 61167 |
| 12-Apr | 1660 | 62827 |
| 13-Apr | 1572 | 64399 |
| 14-Apr | 2100 | 66499 |
| 15-Apr | 3661 | 70160 |
| 16-Apr | 4241 | 74401 |
| 17-Apr | 4677 | 79078 |
| 18-Apr | 4146 | 83224 |
| 19-Apr | 3081 | 86305 |
| 20-Apr | 3203 | 89508 |
| 21-Apr | 5289 | 94797 |
| 22-Apr | 6480 | 101277 |
| 23-Apr | 6961 | 108238 |
| 24-Apr | 6777 | 115015 |
| 25-Apr | 5966 | 120981 |
| 26-Apr | 2939 | 123920 |
| 27-Apr | 2146 | 126066 |
| 28-Apr | 2637 | 128703 |
| 29-Apr | 5867 | 134570 |
| 30-Apr | 5328 | 139898 |
Note: Two sets of cumulative test data have been reconciled to give cumulative total from 22 January 2020 when testing began.


