
Table of Contents

We are at
Level 4of New Zealand’s four-level COVID-19 alert system. It is likely Level 4 measures will stay in place for a number of weeks. More information on alert levels.
- Everyone must now stay home, except those providing essential services.
- Only make physical contact with those that you live with.
Government COVID-19 Response Briefing
The All of Government COVID-19 National Response will provide an update at 1.00 pm today.
Speakers:
- Finance Minister Grant Robertson
- Director of Public Health Dr Caroline McElnay
Ministry of Health Update:
- 5 new cases, 2 confirmed, 3 probable
- 1456 total cases
- Another death, from Rosewood cluster, man in his 60s
- 10th from Rosewood cluster to die
- 1095 recovered, increase of 30
- 8 in hospital, 1 in ICU
- 16 significant clusters
- 6961 tested completed yesterday
- 108,238 total tests
Finance Minister Briefing:
- Wage subsidy scheme: Robertson says all companies will need to stand by their applications when the auditors come, and if circumstances have changed and the money should be returned, they should get hold of MSD.
- Wage subsidy: being paid back, Robertson says the audit team is looking at the applications. Anyone unsure should get in touch.
- Demand for food parcels has increased. Robertson says: “I do recognise that for some New Zealanders this is a tough time” but he said the help was there.
- Robertson says supporting local businesses will make a difference to small business owners
- Level 3 is still a restrictive environment – stay in your bubble, stay at home if you can, keep it local – these things will make a difference.
Yesterday’s details:
- 2 new deaths to report, They were based in Dunedin and Christchurch.
- 3 new cases
- 1451 cases, same as yesterday, remains same level because the positive cases may have already been recorded in Uruguay.
- 101,277 tests processed so far
- 6480 tests yesterday
- 8 people in hospital, 1 in ICU
- 16 significant clusters
- Health services under level 3: hospitals remain open for acute care
| Total | Change in last 24 hours | |
|---|---|---|
| Number of confirmed cases in New Zealand | 1,114 | 2 |
| Number of probable cases | 342 | 3 |
| Number of confirmed and probable cases | 1,456 | 5 |
| Number of cases currently in hospital | 8 | 0 |
| Number of recovered cases | 1,095 | 30 |
| Number of deaths | 17 | 1 |
Notes:
- Note: Three confirmed cases reported yesterday have been reclassified as under investigation to allow checks on whether they were counted in Uruguay’s case total before arrival in New Zealand. This is to prevent double counting by the World Health Organization. We had two new confirmed cases in the past 24 hours, making a total decrease of 1 case today.
View details of confirmed and probable cases.
View details of significant COVID-19 clusters.
View data for testing rates by ethnicity and DHB.
View interactive map and dashboard.
Confirmed and probable cases by DHB
Total cases by DHB in hospital
| DHB | Total cases |
|---|---|
| Auckland | 4 |
| Bay of Plenty | 1 |
| Counties Manukau (Middlemore) | 1 |
| South Canterbury | 1 |
| Waitemat? | 1 |
| Total | 8 |
Note: One of the 8 in hospital is in ICU as at 9:00am 24 April 2020
The above count excludes the five patients in Waitakere Hospital who have been moved from their aged residential care facility due to staffing issues.
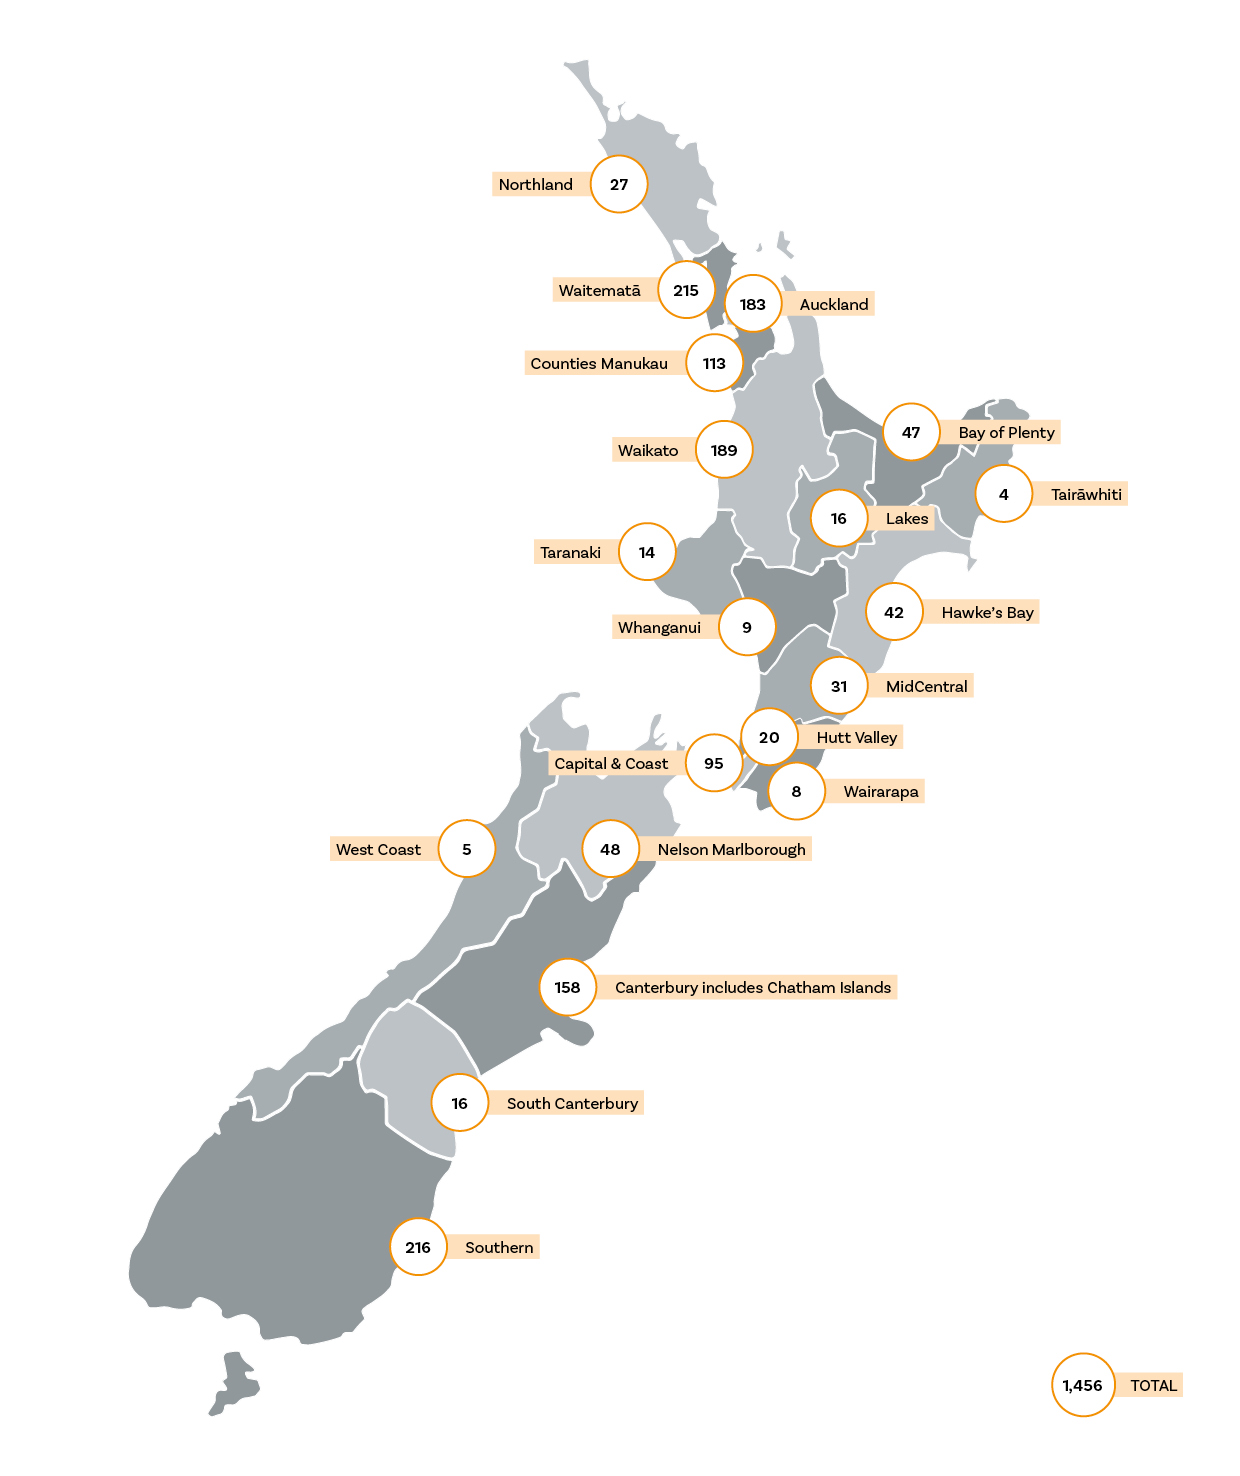
Download the Map of confirmed and probable cases by DHB (PDF, 282 KB).
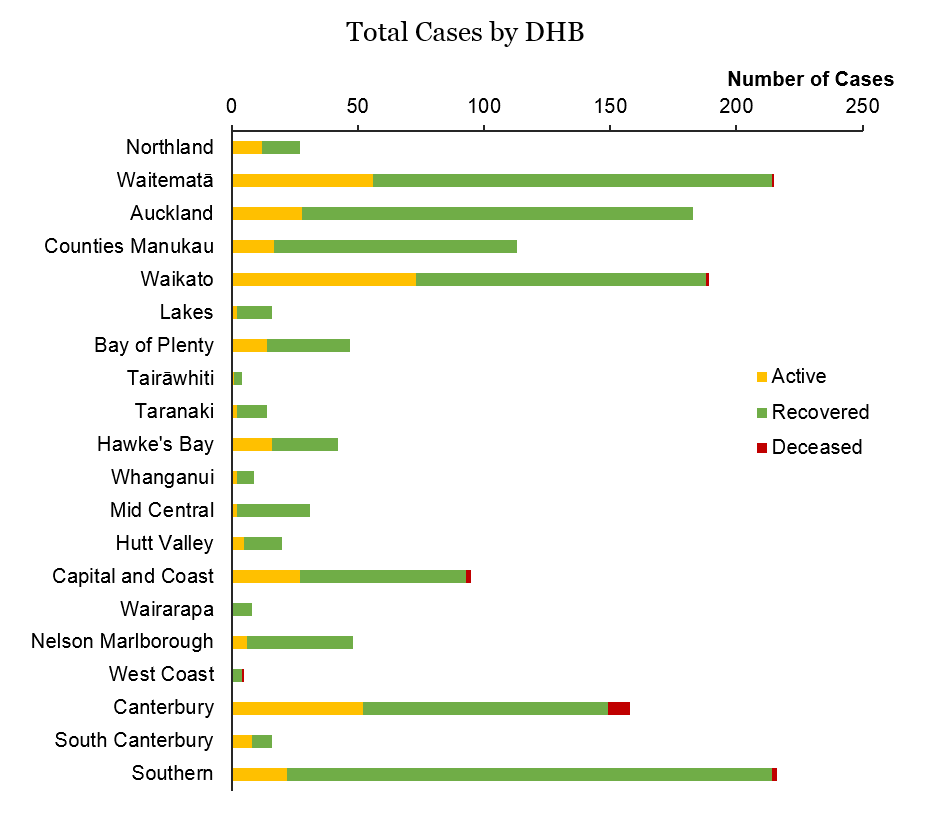
Total cases in hospital by DHB
| DHB | Active | Recovered | Deceased | Total | Change in last 24 hours |
|---|---|---|---|---|---|
| Auckland | 28 | 155 | 183 | -3 | |
| Bay of Plenty | 14 | 33 | 47 | 0 | |
| Canterbury | 52 | 97 | 10 | 158 | 1 |
| Capital and Coast | 27 | 66 | 2 | 95 | 0 |
| Counties Manukau | 17 | 96 | 113 | 2 | |
| Hawke’s Bay | 16 | 26 | 42 | 0 | |
| Hutt Valley | 5 | 15 | 20 | 0 | |
| Lakes | 2 | 14 | 16 | 0 | |
| Mid Central | 2 | 29 | 31 | 0 | |
| Nelson Marlborough | 6 | 42 | 48 | 0 | |
| Northland | 12 | 15 | 27 | 0 | |
| South Canterbury | 8 | 8 | 16 | 0 | |
| Southern | 22 | 192 | 2 | 216 | 0 |
| Tair?whiti | 1 | 3 | 4 | 0 | |
| Taranaki | 2 | 12 | 14 | 0 | |
| Waikato | 73 | 115 | 1 | 189 | 3 |
| Wairarapa | 0 | 8 | 8 | 0 | |
| Waitemat? | 56 | 158 | 1 | 215 | 3 |
| West Coast | 0 | 4 | 1 | 5 | 0 |
| Whanganui | 2 | 7 | 9 | 0 | |
| Total | 345 | 1095 | 17 | 1456 | 6 |
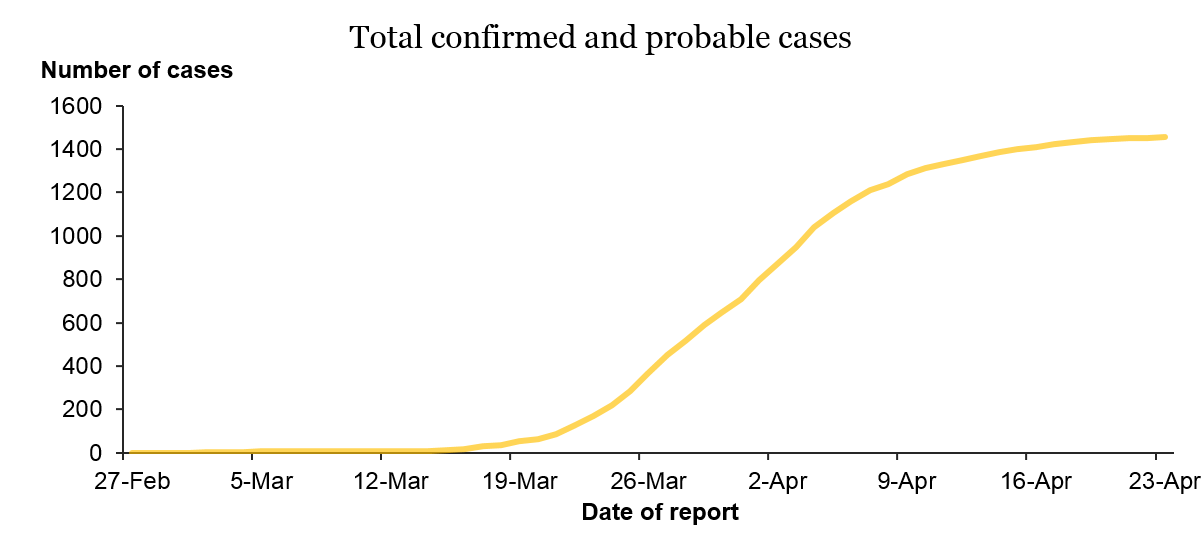
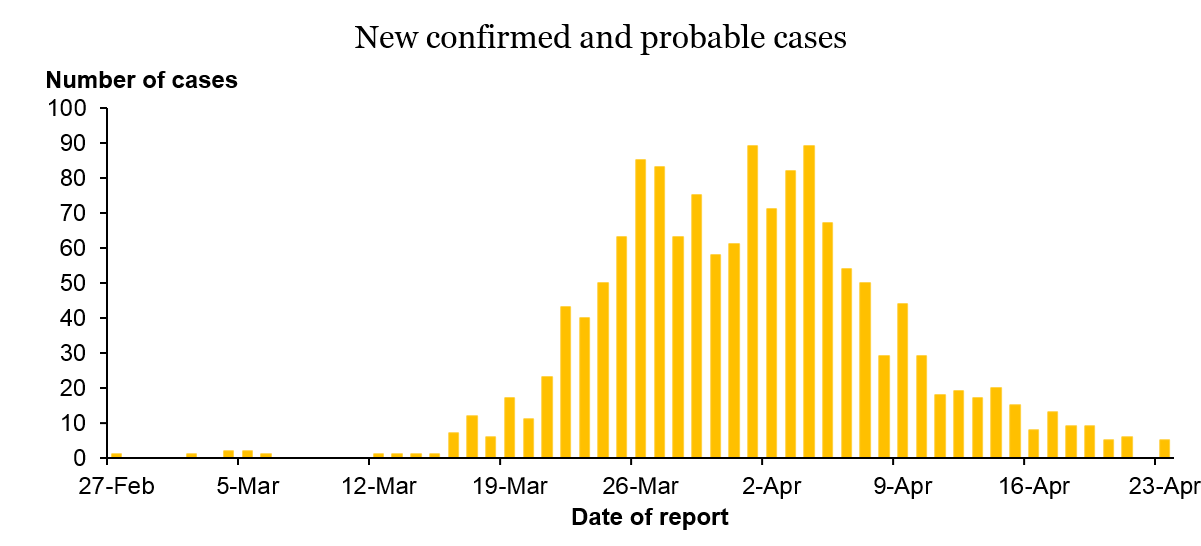
Epidemic Curve
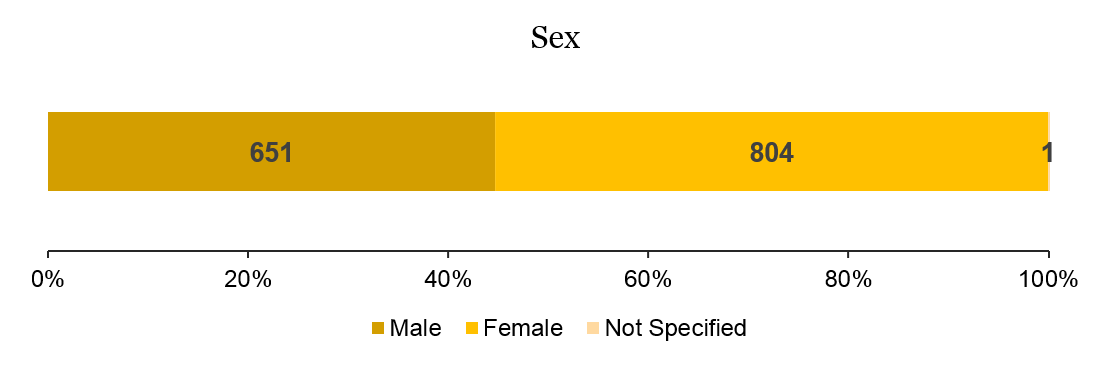
Total Cases by Age and Gender
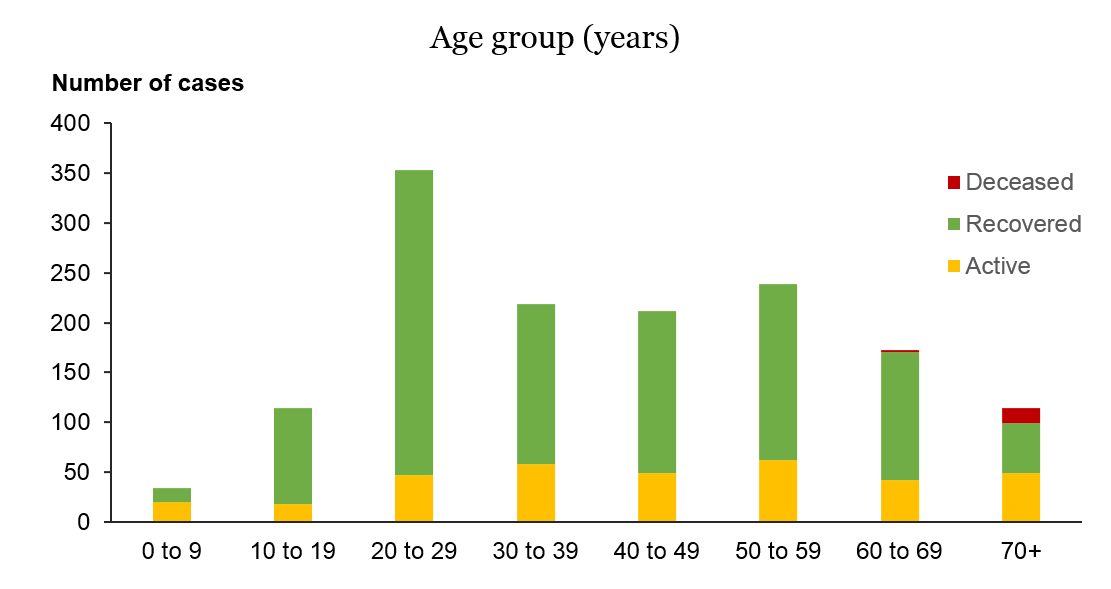
| Age Group | Active | Recovered | Deceased | Total |
|---|---|---|---|---|
| 0 to 9 | 20 | 14 | 34 | |
| 10 to 19 | 18 | 96 | 114 | |
| 20 to 29 | 47 | 306 | 353 | |
| 30 to 39 | 58 | 161 | 219 | |
| 40 to 49 | 49 | 163 | 212 | |
| 50 to 59 | 62 | 177 | 239 | |
| 60 to 69 | 42 | 128 | 2 | 171 |
| 70+ | 49 | 50 | 15 | 114 |
| Total | 344 | 1095 | 17 | 1456 |
Ethnicity percentages of all cases
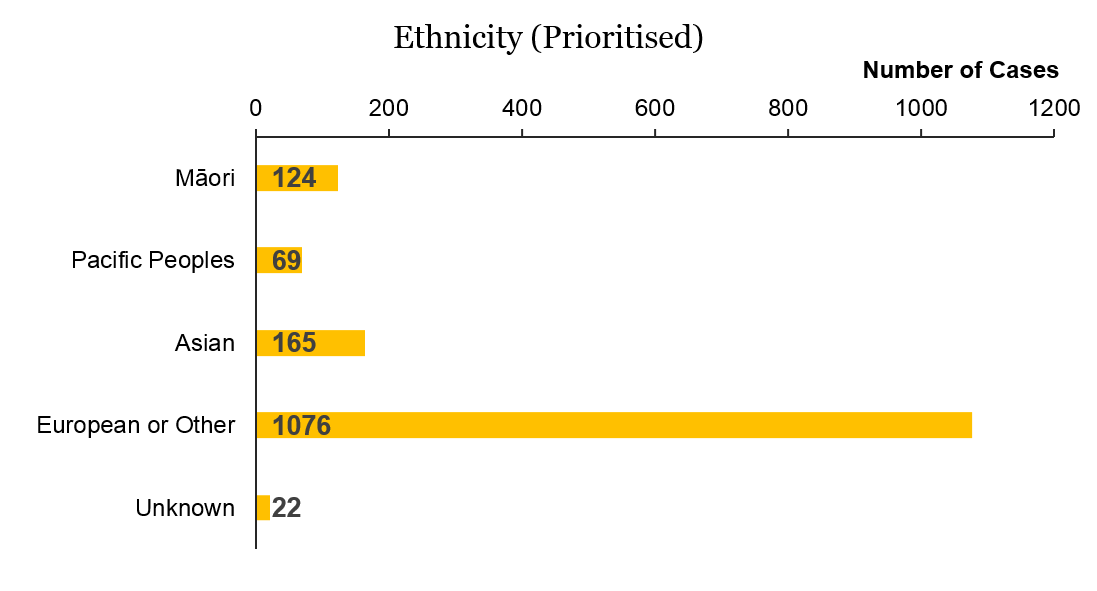
Note: A person who identifies with more than one ethnic group is allocated to a single ethnic group in the following order of priority: Maori, Pacific, Asian and European/Other.
For a detailed break down of ethnicity and DHB region testing see Testing by region.
Transmission
| Imported cases | 39% |
| Imported related cases | 41% |
| Locally acquired cases, epidemiologically linked | 14% |
| Locally acquired cases, unknown source | 4% |
| Source under investigation | 2% |
Source: ESR EpiSurv extract as at 09:00 24 April 2020
Please note that ESR has changed the source definitions, cases have been classified by source of infection as follows:
- Imported cases: Cases with a reported history of international travel within 14 days of onset.
- Import related cases: Cases that have a reported link (close contact or epidemiological link) to an imported/overseas acquired case.
- Locally acquired cases, epidemiologically linked: Cases that have a reported link (close contact or other epidemiological link) to a locally acquired case with unknown source.
- Locally acquired cases, unknown source: Cases that have no reported history of international travel within 14 days of onset and no recorded epidemiological link to a source case.
- Source of infection remains under investigation whereby source of infection could not be classified due to incomplete EpiSurv case report forms. These cases are removed from further analyses in the sections below.
Lab testing and capacity
| Lab Testing | Tests | Date |
|---|---|---|
| Total tested yesterday | 6,961 | 23 April 2020 |
| 7-day rolling average | 4,834 | 16 April to 23 April 2020 |
| Total tested to date | 108,238 | 22 January to 23 April 2020 |
| Supplies in stock | 77,129 | 24 April 2020 |
Source: ESR EpiSurv extract as at 09:00 24 April 2020
View a detailed break down of testing rates by ethnicity and DHB region.
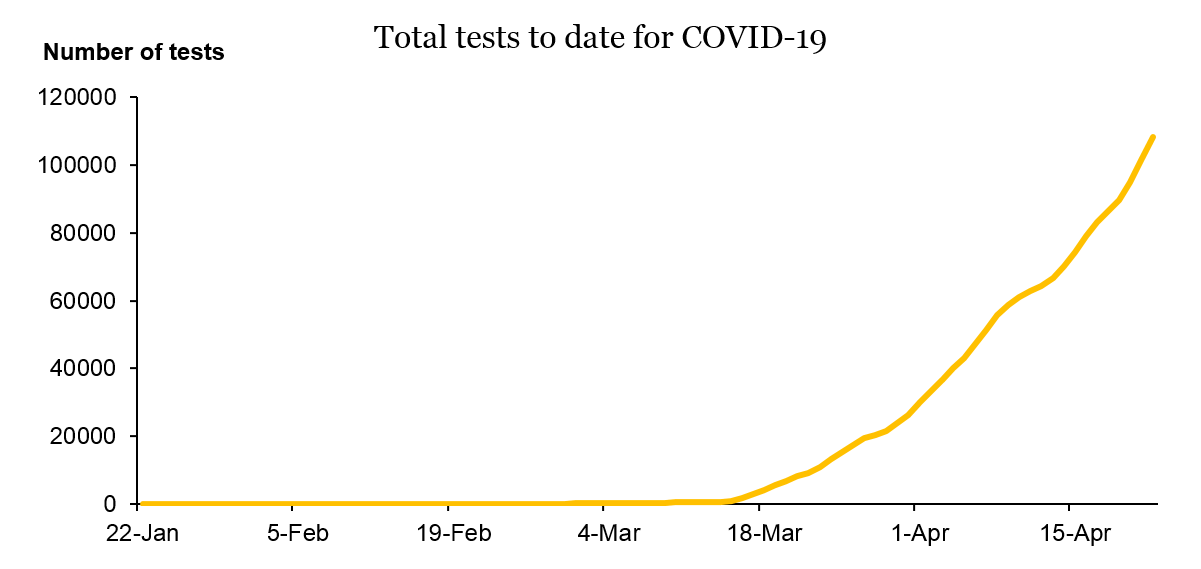
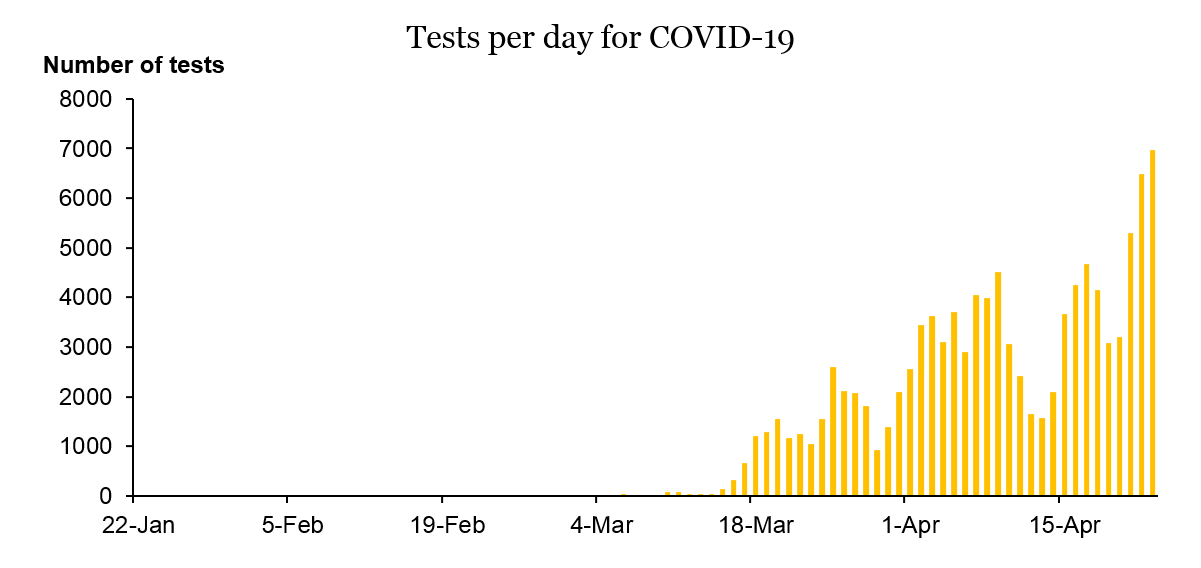
COVID-19 – tests by day and cumulative
| Date | Tests per day | Total tests (cumulative) |
|---|---|---|
| 22 Jan – 8 Mar | 300 | |
| 9-Mar | 12 | 312 |
| 10-Mar | 89 | 401 |
| 11-Mar | 83 | 484 |
| 12-Mar | 31 | 515 |
| 13-Mar | 35 | 550 |
| 14-Mar | 34 | 584 |
| 15-Mar | 142 | 726 |
| 16-Mar | 325 | 1051 |
| 17-Mar | 659 | 1710 |
| 18-Mar | 1209 | 2919 |
| 19-Mar | 1291 | 4210 |
| 20-Mar | 1554 | 5764 |
| 21-Mar | 1176 | 6940 |
| 22-Mar | 1256 | 8196 |
| 23-Mar | 1050 | 9246 |
| 24-Mar | 1544 | 10790 |
| 25-Mar | 2592 | 13382 |
| 26-Mar | 2117 | 15499 |
| 27-Mar | 2067 | 17566 |
| 28-Mar | 1809 | 19375 |
| 29-Mar | 918 | 20293 |
| 30-Mar | 1391 | 21684 |
| 31-Mar | 2093 | 23777 |
| 1-Apr | 2562 | 26339 |
| 2-Apr | 3446 | 29785 |
| 3-Apr | 3631 | 33416 |
| 4-Apr | 3093 | 36509 |
| 5-Apr | 3709 | 40218 |
| 6-Apr | 2908 | 43126 |
| 7-Apr | 4049 | 47175 |
| 8-Apr | 3990 | 51165 |
| 9-Apr | 4520 | 55685 |
| 10-Apr | 3061 | 58746 |
| 11-Apr | 2421 | 61167 |
| 12-Apr | 1660 | 62827 |
| 13-Apr | 1572 | 64399 |
| 14-Apr | 2100 | 66499 |
| 15-Apr | 3661 | 70160 |
| 16-Apr | 4241 | 74401 |
| 17-Apr | 4677 | 79078 |
| 18-Apr | 4146 | 83224 |
| 19-Apr | 3081 | 86305 |
| 20-Apr | 3203 | 89508 |
| 21-Apr | 5289 | 94797 |
| 22-Apr | 6480 | 101,277 |
| 23-Apr | 6961 | 108,238 |
Note: Two sets of cumulative test data have been reconciled to give cumulative total from 22 January 2020 when testing began.


