Table of Contents
Whenever an eco-alarmist tries to scare you, they almost always employ one or both of two gambits: ‘x amount per year’ and ‘on record’.
With regard to the first, it always sounds scary, but what does it actually mean? One we’re all familiar with is the Amazon rainforest: at its peak, back when Sting was peddling lies about “the lungs of the Earth”, the Amazon lost about 20,000 km² per year, “an area nearly the size of New Jersey”. Sounds scary, huh?
Here’s the thing, though: the Amazon rainforest, even decades later, covers six million square kilometres. It could lose an area the size of New Jersey, every year for a century, and still be two-thirds intact.
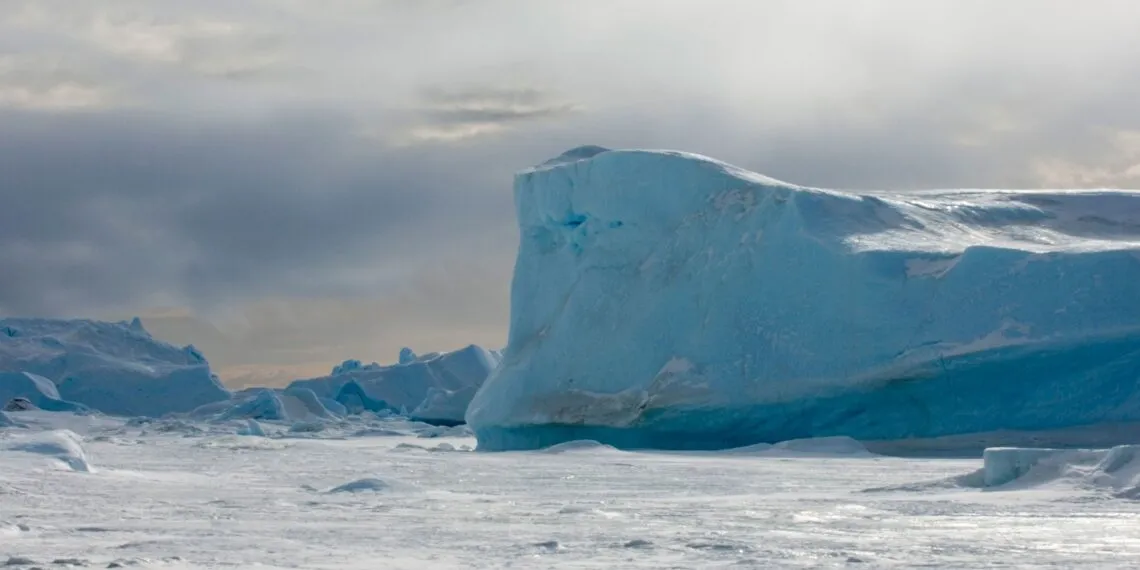
The same applies to the Antarctic ice sheet. Claims that the Antarctic is losing 150 billion tons of ice a year sound really scary. But, like the Amazon rainforest, the Antarctic ice sheet is big. Not just big, gargantuan. The Antarctic ice sheet contains approximately 24.3 million gigatons of ice. That is, 26,786,164,855,462,924 tons.
Which means that, if the ice sheet continues to lose 150 billion tons of ice per year, it will take… 178,574 years to melt entirely.
Pardon me if I leave my water wings in the cupboard for the moment.
The other deceptively scary claim about the Antarctic, is peddling alarmism about the West Antarctic ice sheet. Now, when you hear “East” and “West” Antarctica, you’re almost certainly picturing the continent divided neatly in half, right?
Wrong.
West Antarctica is geographically significantly smaller than the East. More importantly, whereas the East Antarctic ice sheet is almost entirely situated over land, most of the West Antarctic ice sheet sits over two large marine basins. Consequently, West Antarctica has a lot less ice than the East. A lot less: 3.2 million km², compared to 26.5 million km². That is, West Antarctica has just 1/8th the ice cover as the East, most of it over water.
So, even if West Antarctica is losing ice, that doesn’t tell us much about the majority of Antarctic ice, which is in the East.
And how is the East doing? Well, a recent study suggests the alarmist claims of the Al Gores of the world is even more ludicrous than it ever was.
This is where the ‘on record’ gambit comes into play. When it comes to the polar regions, ‘on record’ is a remarkably short time: often much less than a century. Detailed records only began in the 1950s. The recent rediscovery of a series of aerial photographs taken in the 1930s, for producing detailed maps of the East Antarctic coastline, provides a rare detailed glimpse into at least the recent history of parts of the ice sheet.
So, what did researchers find?
Here we explore the earliest, large-scale, aerial image archive of Antarctica to provide a unique record of 21 outlet glaciers along the coastline of East Antarctica since the 1930s. In Lutzow-Holm Bay, our results reveal constant ice surface elevations since the 1930s, and indications of a weakening of local land-fast sea-ice conditions. Along the coastline of Kemp and Mac Robertson, and Ingrid Christensen Coast, we observe a long-term moderate thickening of the glaciers since 1937 and 1960 with periodic thinning and decadal variability.
Which sounds, in other words, an awful lot like natural variability.
Interestingly, the results show an ice retreat long before the modern warming trend.
Despite large variations in size and characteristics, all six glaciers in Lutzow-Holm Bay experienced a net retreat between 1937 and the 1980s, when they reached an almost simultaneous minimum associated with a complete break-up of fast ice in the bay. Another smaller retreat phase occurred around the mid-2000s, with the exception of Shirase, and again during 2016-1847. By far, the largest fluctuations are observed at Shirase Glacier with a total range of almost 90 km in the ice-front position from its 1963 maximum to its minimum in 1988 […]
Since the retreat in the 1980s, all glaciers except Langhovde and Honnorbrygga have, at some point, advanced to a similar marginal position or even extended beyond their extent recorded in 1937.
So, in the late 1930s, a notably warm period, the glaciers reached a maximum. Note that that minimum is a decade before the record El Nino hot year of 1998.
And it’s been snowing more since WWII up until the present.
ERA5 reanalysis data suggest a consistent positive long-term trend in mean annual snowfall along the coastline of Kemp and Mac Robertson Land, and Ingrid Christensen Coast since the 1940s, whereas in Lutzow-Holm Bay, snowfall has remained almost constant. The long-term trend is most pronounced in Kemp and Mac Robertson Land, where snowfall increased by ~50 % between 1940 and 2022, corresponding to 17.3 mm of water equivalent (w.e.) per decade, whereas along Ingrid Christensen Coast, the increase is around 15% equivalent to 5.3 mm w.e. per decade.
And more snow in Antarctica eventually becomes more ice.
We hypothesize that the observed increase in surface elevation since 1937 in Kemp and Mac Robertson Land is likely a result of changes in precipitation patterns. The absence of dynamic ice changes, observed from stable frontal positions since the 1930s and flow velocities since the 1950s suggest that the observed ice surface increase results from the increase in precipitation. The periodic thinning and decadal variability observed within the long-term trends in glacier surface elevation in all regions, demonstrates the natural variability inherent in these systems.
Nature
(Emphasis added.)
Are you still scared?


