
Table of Contents
John Maunder
The following is an update on the subject from pages 173 to 184 of my book.
The chart below shows that since 1979, when reliable satellite observations became available, there has been an overall warming trend in the average tropospheric temperatures, apart from, at times, milder temperatures since about 1999, but with three significant warm periods associated with the El Nino events in 1998 , 2015-16, and 2019.
The latest global average temperatures of the troposphere updated to March 2022 – observed from US National Oceanic and Atmospheric Administration satellites – are computed by the University of Alabama at Huntsville in the United States. The data shows variations from the 30 year period 1981-2010.
Since 1979, NOAA satellites have been carrying instruments which measure the natural microwave thermal emissions from oxygen in the atmosphere.
The intensity of the signals these microwave radiometers measure at different microwave frequencies is directly proportional to the temperature of different, deep layers of the atmosphere.
Every month, researchers at the University of Alabama (Dr John Christy and Dr Roy Spencer) update global temperature datasets that represent the piecing together of the temperature data from a total of fourteen instruments flying on different satellites over the years.
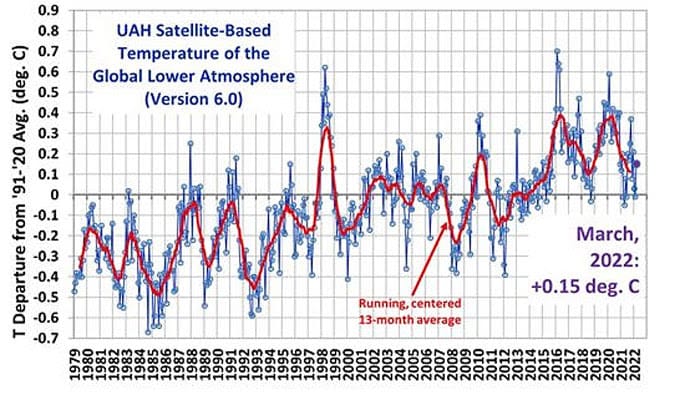
The graph above represents the latest update; updates are usually made within the first week of every month. Contrary to some reports, the satellite measurements are not calibrated in any way with the global surface-based thermometer records of temperature.
They instead use their own onboard precision redundant platinum resistance thermometers calibrated to a laboratory reference standard before launch.
The troposphere is the lowest layer of Earth’s atmosphere.
It contains approximately 75 per cent of the atmosphere’s mass and 99 per cent of its water vapour and aerosols.
The average depth of the troposphere is about 17km in the middle latitudes.
The latest data for March 2022 is +0.15 degrees C.
Below are the various regional Lower Atmospheric Temperature departures from the 30-year average for the last 13 months.
YEAR MO GLOBE NHEM. SHEM. TROPIC USA48 ARCTIC AUST
2021 01 0.12 0.34 -0.09 -0.08 0.36 0.50 -0.522021 02 0.20 0.32 0.08 -0.14 -0.65 0.07 -0.272021 03 -0.01 0.13 -0.14 -0.29 0.59 -0.78 -0.792021 04 -0.05 0.05 -0.15 -0.28 -0.02 0.02 0.292021 05 0.08 0.14 0.03 0.06 -0.41 -0.04 0.022021 06 -0.01 0.31 -0.32 -0.14 1.44 0.63 -0.762021 07 0.20 0.33 0.07 0.13 0.58 0.43 0.802021 08 0.17 0.27 0.08 0.07 0.33 0.83 -0.022021 09 0.25 0.18 0.33 0.09 0.67 0.02 0.372021 10 0.37 0.46 0.27 0.33 0.84 0.63 0.062021 11 0.08 0.11 0.06 0.14 0.50 -0.42 -0.292021 12 0.21 0.27 0.15 0.03 1.63 0.01 -0.062022 01 0.03 0.06 0.00 -0.24 -0.13 0.68 0.092022 2 -0.01 -0.04 0.01 0.01 -0.05 0.04 -0.02 2022 3 0.15 0.28 0.10 0.27 0.34 0.23 0.02
BUY Your Own Copy of Dr John Maunders book Fifteen Shades of Climate Today.


